
A version of this article was presented at the 2022 FSAE EV Workshop.
Internal Combustion cars are not good Electric Vehicle platforms.
Start with a great race car. The Red Bull Racing RB18 won 17 out 22 races in 2022. Would it make a good electric race car? Even if you are just starting out, I think you can spot seven things wrong in this picture.
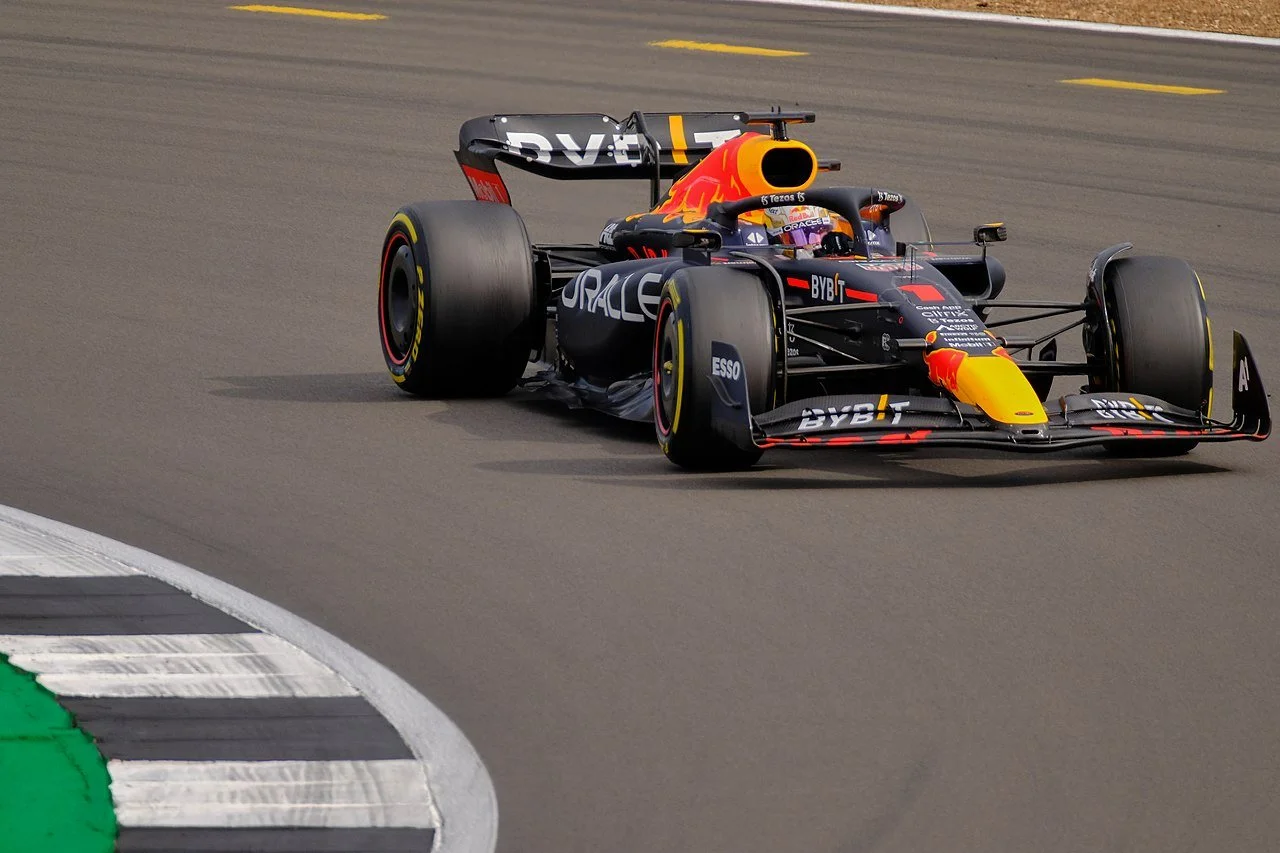
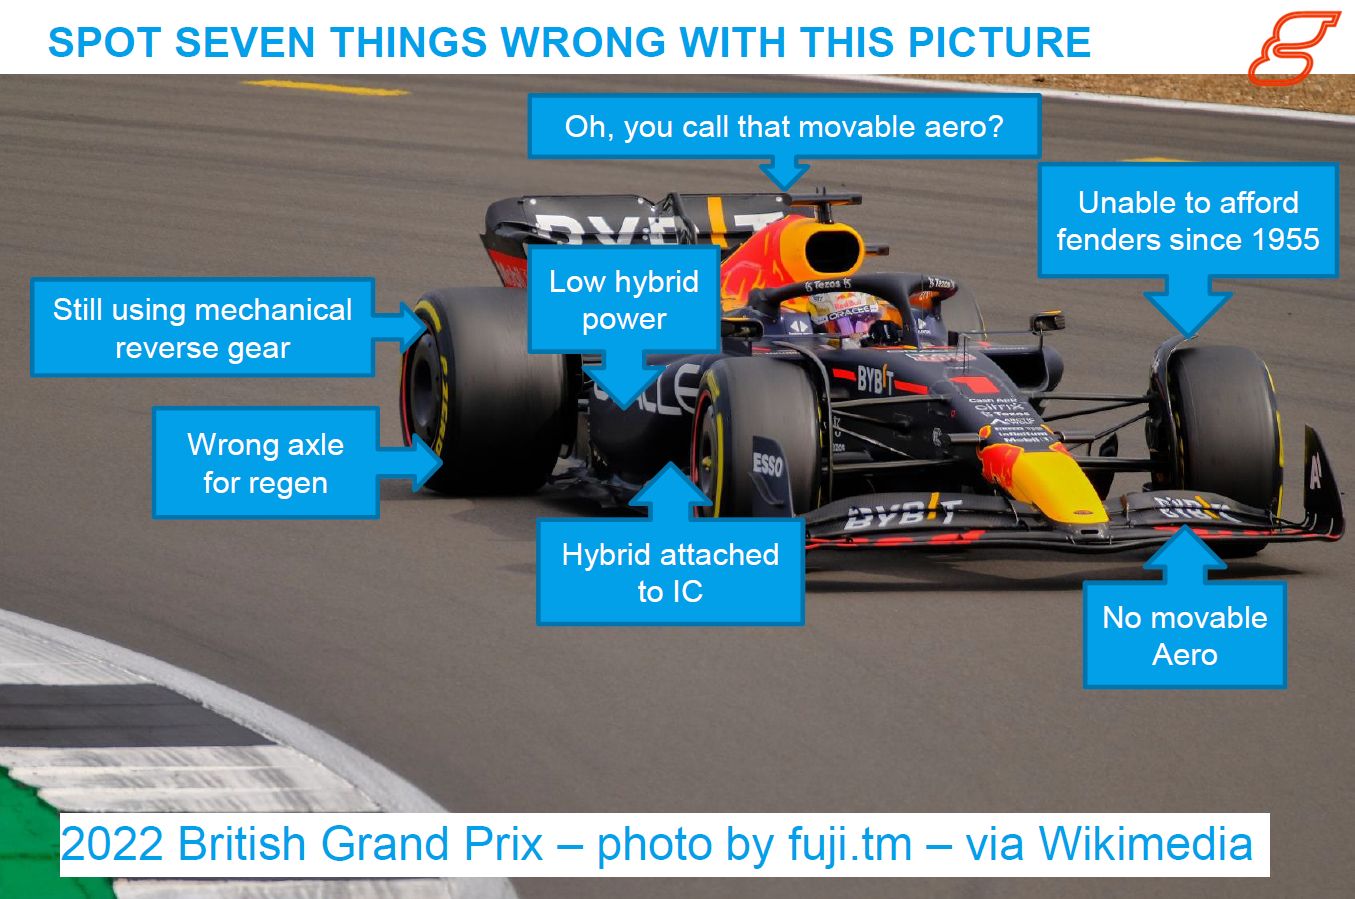
Formula 1 has been unable to afford fenders since 1955.
There's no movable aero on the front of the car. Flexible wings are not in the same league as airplane flaps.
There's some minimal movable aero in the rear. Credit where it's due, this is the era when more people started thinking seriously about eliminating downforce as well as reducing drag.
The electric powertrain is only 120kW and about 2.2kWh, and FSAE EV cars regularly produce 80kW from 5-7kWh batteries.
The electric powertrain is mechanically attached to the IC powertrain which, in my opinion, yikes.
There is a 120kW electric motor, and they're still using a mechanical reverse gear.
Big obvious problem, the regenerative braking is on the wrong axle.
Bad news: Take an Internal Combustion engine car, road or race. Remove the IC powertrain, and replace it with a battery, motor and controller. The result will not be a very good EV. IC and EV powertrains are generally too mismatched to swap one for the other. IC engines and electric motors and controllers have completely different size, mass, and shape. Fuel tanks and batteries have completely different size, mass, and shape.
Good news: FSAE EV and IC designs can be more similar than most road or race cars. The endurance competition is 22km, so many batteries wind up being similar in mass to engines used in IC.
CHASSIS
Article Category Chassis
In a perfect world, the chassis is the very last design finalized, connecting the dots to hold the suspension, the powertrain, the driver, everything. You are building your own batteries in FSAE EV. It is 10 times harder than putting a motorcycle engine into a car. It is as complicated as designing a cylinder head from a blank sheet of paper. The chassis is the easiest thing to design. Designing the chassis before designing the battery makes the hardest part of the design even harder. It is much easier to design a chassis to fit an engine, or a chassis to fit a battery, than the other way around.
In a perfect world, submit the SES early in the fall, identify any issues, get approved, and build before the new year. Then test all spring, get the car dialed in, get the drivers really comfortable, collect all the data you're going to use to understand the car and show off in design judging. And even have the new leads start next year's designs in the spring, while graduating members are still around to answer questions.
General chassis principles are exactly the same as IC. For tube frames, the rules require an upper load path, plus a lower load path, and fully triangulated in between. If it's a monocoque, the process is exactly the same: Take a composite panel, run a three-point bend test on it, and the SES will derive material properties. The SES will make sure the monocoque made from those panels is stronger than the tubes being replaced.
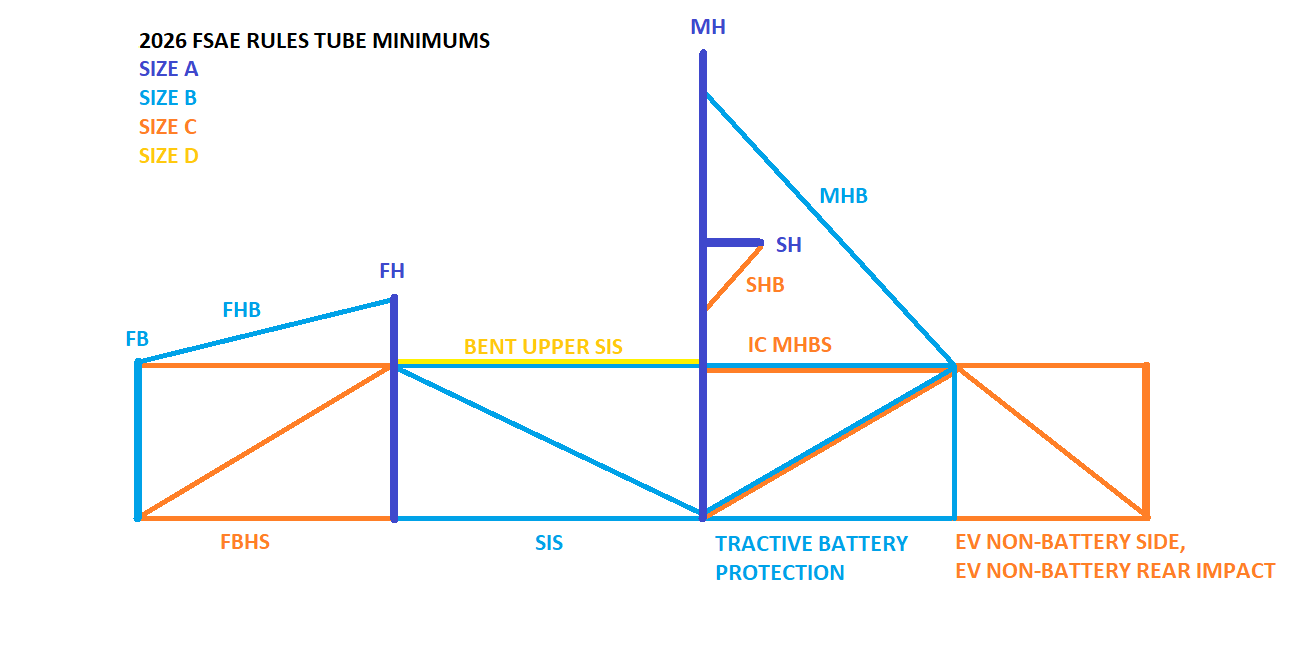
For IC teams, the rules basically ended at the back of the Main Hoop Braces and the block of the IC engine. In EV, side protection is required all the way back to the Rear Impact protection. The Rear Bulkhead might be the rearmost point of the car. It might be ahead of a differential. It might be ahead of an unregulated suspension box. But the Rear Bulkhead is always completely behind the inboard Tractive System, and the RBHS is triangulated forward to the Main Hoop.
Try to fit the chassis reasonably closely around the battery. Maintain 25 mm of clearance for crush protection. At the same time, you want the ability to electrically disconnect the battery in the car while wearing high voltage gloves, in case there is a fault. You want very easy installation and removal, because that happens many times during test fits, during testing, and at competition. Integrate with the cart it rides on. It's a whole system.
It is illegal to put more than two battery mounts on one tube segment. All attachment points for the tractive battery must attach to a Size B tube between two triangulated nodes. Tubes straight or angled across the car between nodes on either side qualify. The intent is to prohibit battery mounts on tubes that are not the main load paths of the chassis. The intent is for chassis design to get the main rules load paths and maybe some cross tubes close to where the battery mounts will be, then use well gusseted battery and chassis mount design to span the shortest remaining distances from the chassis to the battery.
For the battery mounts themselves, the SES accounts for fastener pull out, which is in the direction of the fastener axis, and fastener tear out, which is normal to the fastener axis. The SES accounts for the bending of the mount, measuring the offset of the fastener from the nearest module, and the footprint of the mount against the module. The footprint of the mount cannot have a gap to the modules.
The modules need their own structure to make sure there are strong load paths to prevent cell crush in X, Y, and Z.
For more information, see Engineering A Lighter Chassis, Part 1
SUSPENSION
Articles Tagged Suspension
The suspension in EV works exactly the same as in IC. Exactly the same as all the classic resources on vehicle dynamics and race car design.
critical specifications for balance
The importance of matching up the front to rear mass percentage (including driver!), tire size, and downforce to maximize cornering and handling performance is exactly the same in EV and IC. If all four tires are the same, target a weight distribution (including driver!) of 50:50, with an aero distribution just rearward of 50:50 (including drag moment).
For rear wheel drive, consider larger tires on the rear. A larger rear tire percentage allows a higher rear mass percentage, increasing rear grip for acceleration. Match the front mass percentage including driver to the front tire percentage. Larger rear tires plus higher rear mass percentage will also increase RWD regenerative braking capability.
If all four tires are the same, with a 50:50 balance, AWD acceleration and regen capability at the front and rear tires are equal and opposite. And 80kW is allowed for both acceleration and regen. So the benefits of a particular motor's performance are the same front and rear.
The wheelbase and track compromises are exactly the same as IC. Wider track reduces lateral load transfer, giving higher grip, and it's easier to pass the tilt test. But there's less maneuverability between the cones on skinny FSAE courses, and there is more distance to move side to side through a slalom with a wider track. Narrower track widths and shorter wheelbases both lower the polar moment of inertia. Wheels and tires and hub motors are very big components of overall polar moment. But a narrower track and a shorter wheelbase increase load transfer.
Except for track width and wheelbase, suspension design does not change the total amount of load transfer. The kinematics are responsible for controlling the camber and toe when the car is squatting during acceleration, diving during braking, rolling during cornering, and every combination. Design easy, fast camber and toe adjustments. The steering geometry might cause big effects depending on kingpin, caster, and scrub radius. Anti-squat, anti-dive, and roll centers control how much load transfer goes through springs, dampers, and roll bars, and how much goes through the (hopefully) non-deflecting suspension links.
FSAE cars have to navigate a very tight minimum radius hairpin. Ackermann is the geometrically perfect inside wheel angle for any radius defined by the outside front wheel. I think the best way to think about Ackermann is how many degrees above or below the geometrically perfect target the inside wheel is for a given radius. It's a graph, not a single number. To get more Ackermann, or even just to test different levels, toe the front out. Give the inside tire a head start. To get less Ackermann, toe the front in.
Four wheel motors are a lot of fun. With enough torque and regen, they can go to any point on the friction circle for the tire they are attached to. Trading off lateral force for positive or negative longitudinal force can add a yaw moment, or reduce a yaw moment. No different than driving an IC car on the limit, using the powertrain and brakes for positive or negative torque at the wheels, but the ability to control each wheel independently opens up new dimensions. Torque vectoring can create a yaw moment before taking on a slip angle and creating lateral force.
BRAKES
Article Category Brakes
The process for hydraulic brakes is exactly the same in EV and IC.
(1.) Determine the brake bias from the tire grip:
The primary factor is longitudinal tire force at ground level creates a moment on the center of mass height. The vertical load increases on the front wheels and decreases on the rear wheels to balance the braking moment. Some teams measure their center of mass height (including a belted, helmeted driver) by tilting the car from flat to a known angle on scales. I've had better success tilting sideways to the balance point. A starting guess on the low side is 2/3 of the longitudinal total at the front tires, and 1/3 of the longitudinal total at the rear tires. A secondary component of total front and rear vertical loads comes from the drag moment above the center of mass height, and downforce. (And aero forces change with speed.) Tertiary effects are the changes in aero forces from ride height and pitch. Size the hydraulic systems proportional to braking torque front and rear. Size rotor and brake pad mass to heat up proportional to the front::rear energy to avoid balance changes due to different brake pad temperatures. Some teams will use estimated values for brake mu, some will reverse engineer it from driving last year's car, some will characterize materials by spinning them up on a brake dyno.
(2.) Size the hydraulic brake system from the tire force to the pedal force:
Tire longitudinal force
normal * tire mu
Rotor torque
longitudinal force * tire radius
Caliper force
torque / ( rotor middle radius * pad mu )
Cylinder and pedal force
Pressure = caliper force / caliper piston area
Pedal = pressure * cylinder area / pedal ratio
Size the caliper pistons and brake cylinders A. for a pedal force that can easily lock all four tires when the brake test is super grippy, and B. for a pedal force where the driver can comfortably do constant reps for 20 minutes in a heat wave without getting tired. Shaky legs lead to missed apexes, which lead to 2 second cone penalties, which lead to 20 second off-course penalties. Some teams start by taking their drivers and having them push as hard as they can on a scale. Other teams go across campus and find small test subjects to set the lower end of the range.
An equally important requirement that leads to higher pedal forces is sizing the caliper pistons and brake cylinders for minimal travel. I wish I had good scientific citations to share, but empirically over decades of performance driving, we know it is easier for a driver to make fine adjustments with brake pressure (race car) than with foot position (road car). The less the pedal moves, the easier it is to modulate and balance on the limit. Make sure the return on the pedal is really fast, minimize friction.
(3.) Fully engineer the Brake Over Travel Switch
The brake over travel switch is a serious engineering project, not an afterthought. It must trigger if there is brake system failure. It must not trigger under normal operation and cause a DNF.
(4.) Articles Tagged Regen
Ideally, regen does all of the braking during the endurance event, and friction does none of the braking. Top teams make this their target in the endurance event. Capturing more energy makes the car faster and more efficient. It is a hard project. There are practical issues beyond just battery thermals. There's the 80kW system limit in FSAE. Brake by wire / electronic brake distribution is prohibited in FSAE. Single axle regen (and unbalanced four wheel regen) completely throws off the hydraulic and brake temperature balances. There's the question of regen and hydraulic pedal feel, for modulation on the limit. I love one-pedal driving on the road, but race drivers need to modulate pressure, not pulling back foot position. I do not think finger operated regen is a good approach for balancing the car on the limit.
Higher power is easier in EV.
I am from the bad old days where we didn't pay attention to the Efficiency event. We used all 6 gears in the acceleration event and an appalling 6L of 100 Octane in the Endurance event. Our highly, highly developed F4i hit 70kW on our engine dyno, plus a wide, drivable torque curve. That is about the absolute limit of a 20mm restrictor. Made my vision blur the first time I used full throttle and 17,000rpm. (I was supposed to shift at 14,000rpm - it happened very fast.) 80kW is easy in FSAE EV compared to 70kW in FSAE IC. So is AWD.
Maximum acceleration in FSAE EV comes from a powertrain that can always either spin the tires, or is at the 80kW rules maximum. There are electric motors that only reach 80kW at maximum rpm. That would mean 80kW is only available at top speed. In IC, gearboxes exist to keep the engine at peak power throughout the speed range. In EV, you just use a larger, more powerful motor and limit output to 80kW. It will weigh less and be more efficient than adding a multi-speed gearbox to a smaller, less powerful motor.
It's all about thermal management.
Articles Tagged Cooling
If you are an electrical engineer, you get to learn about thermodynamics, and other electrical engineers will think you are a wizard. In batteries, motors, controllers, and other electronics, using power creates heat. Nothing is 100% efficient, and every percent below 100% efficiency means more heat is generated. The heat generated in Watts in a component equals Power (W) * (100% - component efficiency).
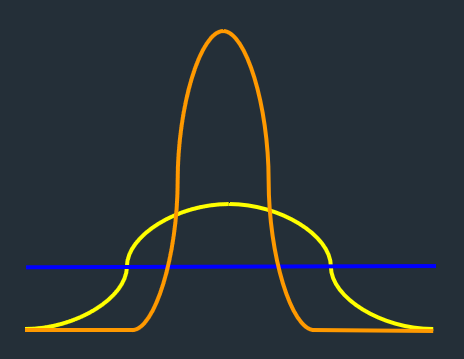
There is a continuous level of power you can put through any component. At that power level, the amount of heat energy generated matches the amount of energy that can be dissipated to the environment, and the temperature of the component stabilizes above ambient.
Running a power level above the continuous limit for too long means the component temperature would keep rising until failure, because it cannot get rid of the heat fast enough. Your powertrain will be limited by its components with the lowest continuous power and the lowest peak power. It is a good idea to match the steady and peak component limits.
Use the rated steady state power as a Root Mean Square limit. Acceleration and regen both cause heat generation. (Efficiency for regen may be different, charging vs. discharging.) The fastest strategy will spend time at power above the RMS limit, causing temperature increases, balanced by time at power below the RMS limit, generating less heat, to allow components to cool. Power * time = energy. With time on the X-axis, (1) high power bursts must be short enough that components do not exceed their maximum temperature, (2) the total area under the power curve (absolute value, accel or regen) must stay below the area of the continuous power limit multiplied by total time.
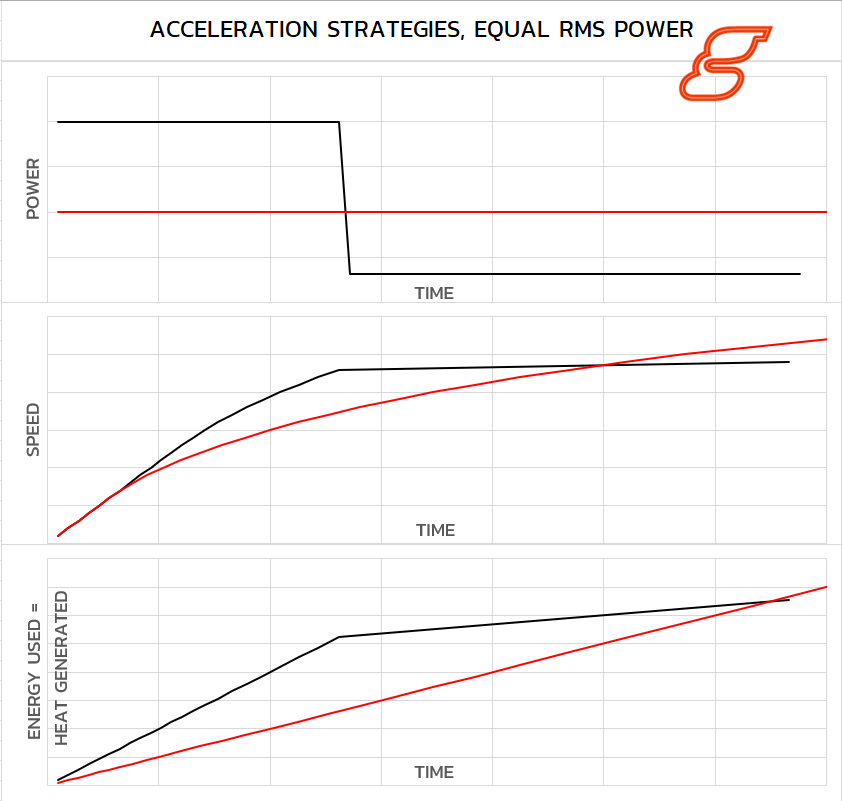
In this example, one car accelerates at continuous power the entire time, shown in red. The other car, shown in black accelerates at 2x continuous power for slightly less than half of the time, then reaches a speed limiter.
Time for the car at continuous power is 5.5% slower over the same distance.
Top speed is limited for the peak acceleration car 11% lower than the speed the car reaches under continuous power
The peak acceleration car uses 7% less energy
The RMS power for the peak acceleration car is 2% lower.
The resolution in my calculation is too large to get the RMS perfectly equal. For maximum performance, drivers need to be trained to use maximum acceleration, cruise, coast, and regen.
More cooling means more power and energy can be used and recovered.
Myth: Electric cars don't need radiators. This can make sense depending on context. In a long range EV for commuting, there is a large battery for range, and a large motor for acceleration. During average operation only a small percentage of peak power is being used. Overall thermal efficiency is much higher for electrical components than for IC, so much less overall heat is being generated. Passive cooling might be enough.
Reality: For FSAE and other racing EVs, maximum performance means high power, fast discharge, maximum heat generation. Most cells are rated for 1C = 1 hour discharge. 3C = 1 hour / 3 = 20 minute discharge is a starting dart throw for endurance.
EV Performance Fundamentals
You want to access a large percentage or even a majority of peak power. You want to maximize cooling to allow higher RMS power across components.
HEAT TRANSFER
Every material takes a certain amount of energy to heat up. This specific heat is Joules per gram per degree Celsius. Every material is transferring energy from hotter to colder. The higher the temperature difference is, the faster the rate of heat transfer. After reaching operating temperature, at continuous power, a component is generating heat at the same rate it is transferring heat to the environment.
There are three ways heat is transferred. Conduction is physically touching. Convection is contact with a moving fluid. (Air is a fluid.) Radiation is electromagnetic waves coming off of the surface. (That's how you can feel the heat coming off something without touching it, whether it's a motor or a parking lot.)
Practical comparison: IC coolant is nearly boiling during normal operation, and can be kept above 100°C if the system is pressurized. If the air temperature at competition is 25°C, there is a 75°C temperature delta to get heat out of the cooling system and into the air. The higher the temperature difference, the faster the heat energy moves from the hotter material to the cooler material.
Some EV motors and controllers might run closer to 100°C. But by rules, the tractive batteries are limited to 60°C. If ambient is 25°C, that's only a 35°C temperature delta, less than half as much. There was only a 10°C temperature delta to reject battery heat when FSAE was in Las Vegas at 50°C. And both of those examples assume maximum battery operating temperature. Exceeding 60°C means disqualification. The smaller the temperature difference, the more airflow is needed, the larger the radiator. So far, every racing electric powertrain I've worked on needed radiators roughly the same size as an IC car in order to run the system hard.
Energy Budget
Articles Tagged Energy Efficiency
Winning Endurance or Efficiency times was plotted against the amount of energy at the wheels for the IC and EV competitions from 2013-2026 (excluding 2016, where data was not available.) From 2013-2021, this was on the same track in Lincoln, then North, Nevada, and Michigan, on the same day. From 2022-2026, the competitions are held on different Michigan courses in different months.
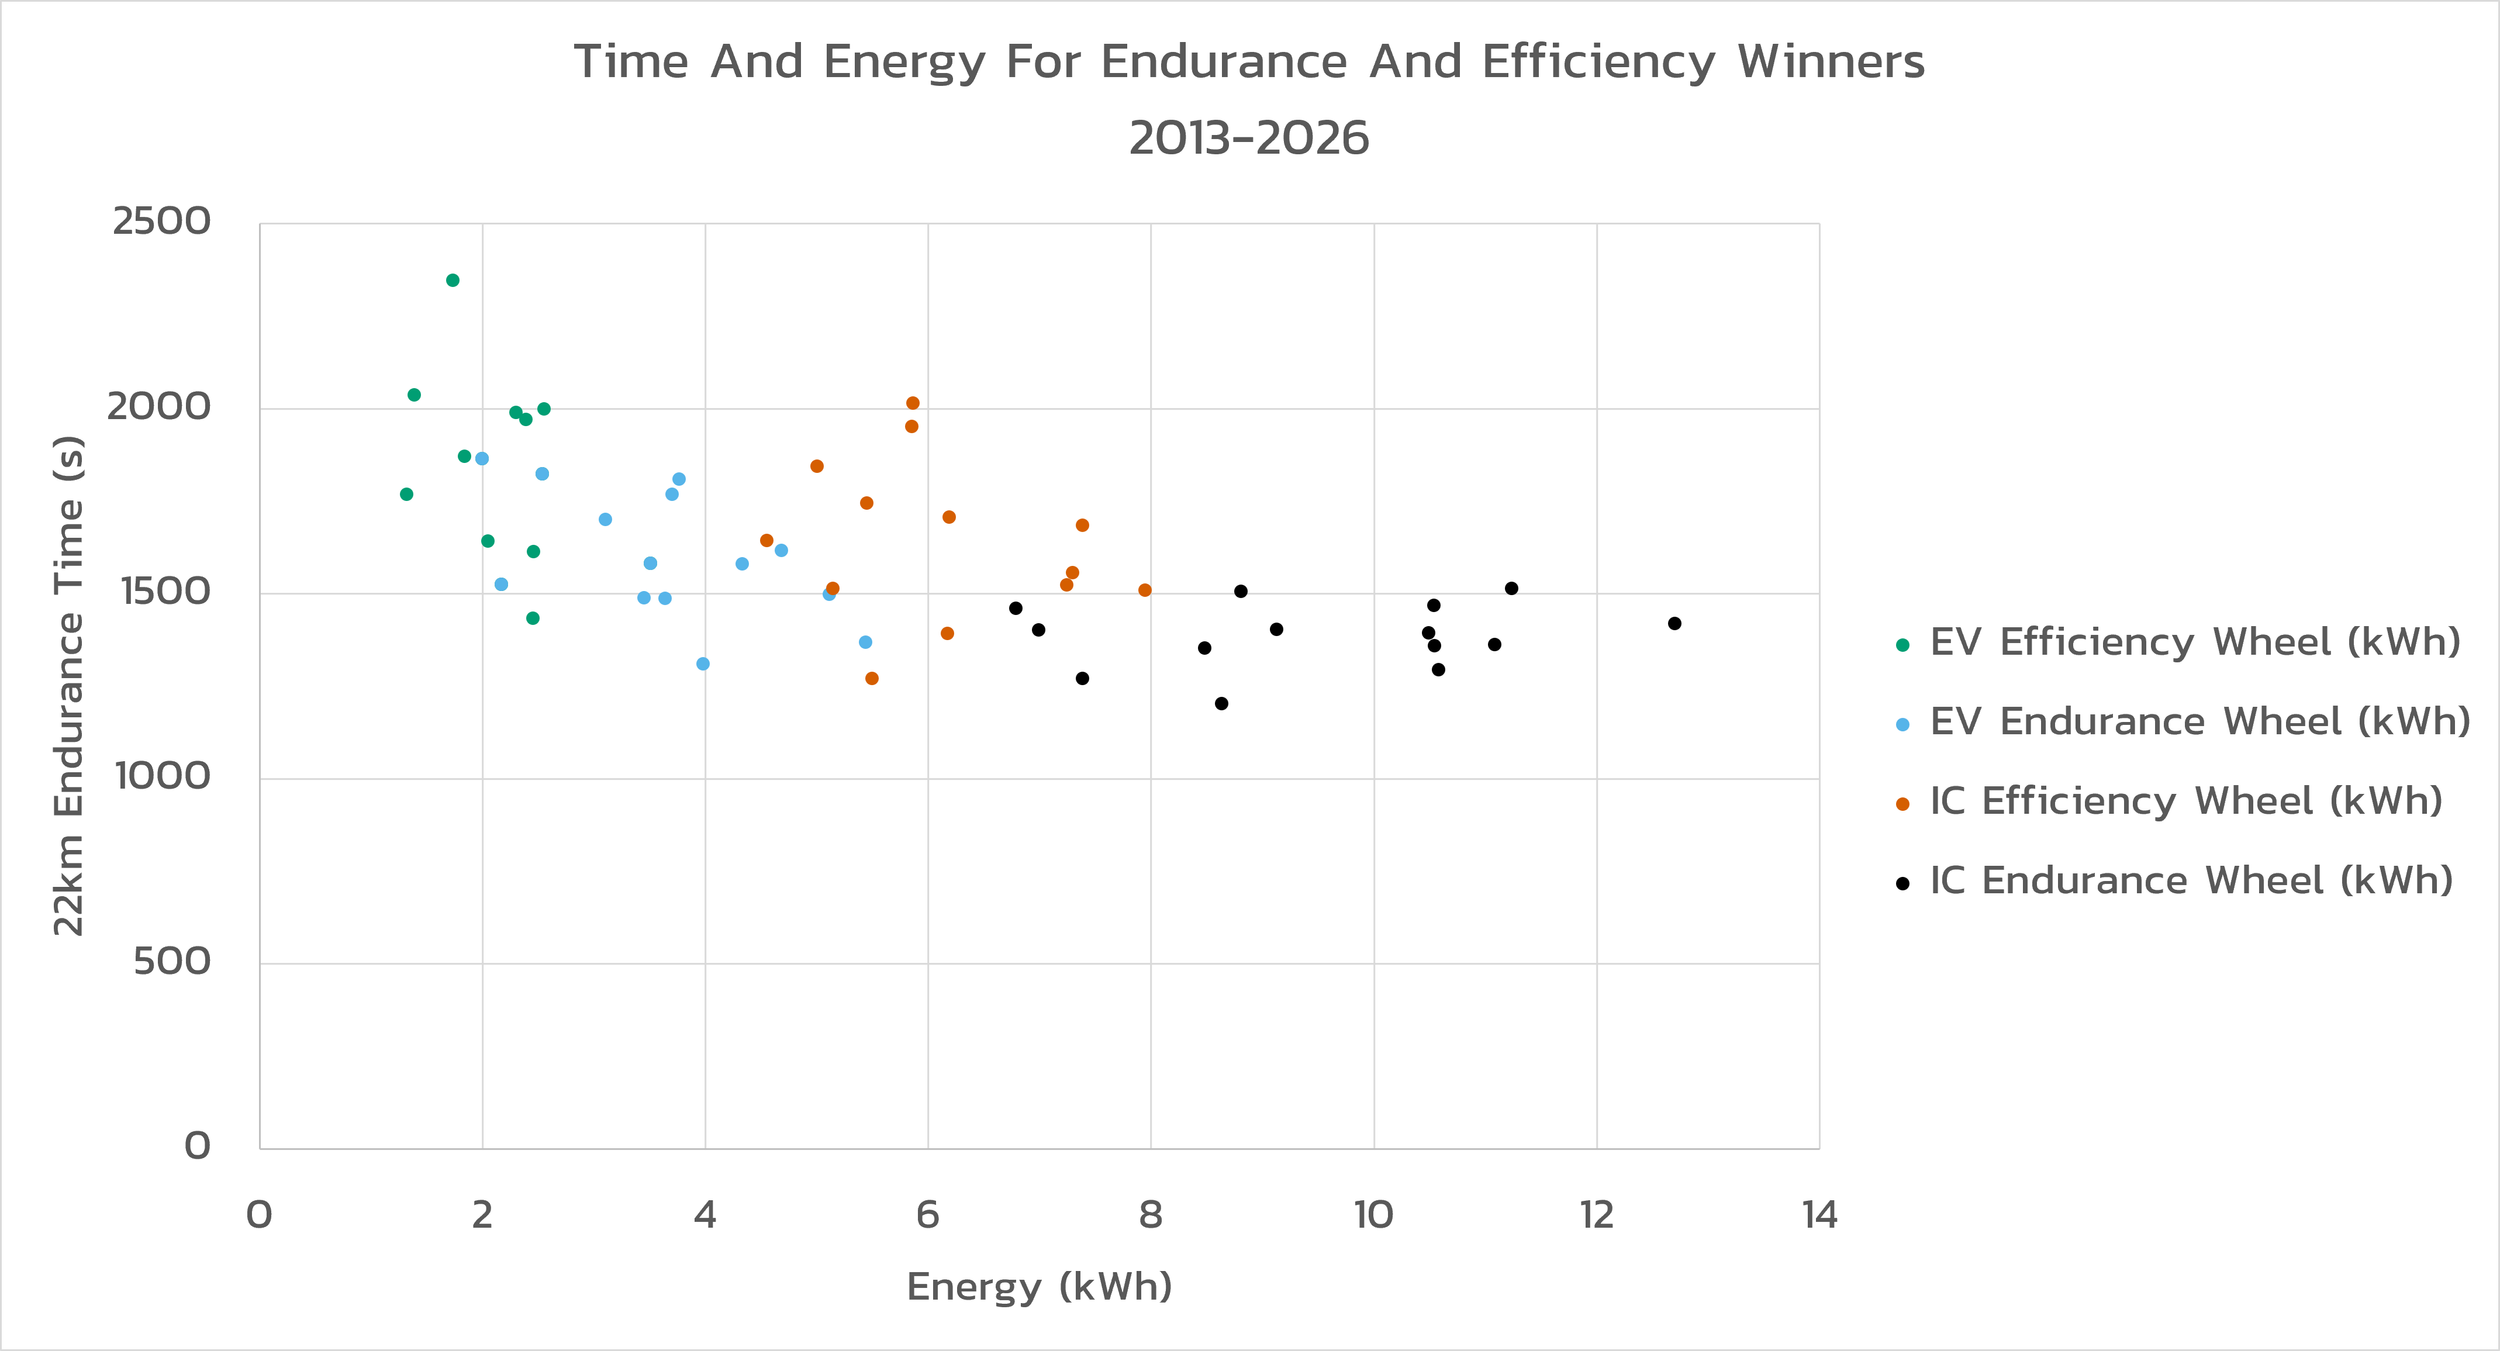
The wheel energy was calculated from total competition energy. In EV, the energy meter total was multiplied by a nominal controller * motor * drivetrain total of 75%. In IC, total energy was calculated by multiplying E85 consumption by 6.308 kWh/L, and gasoline consumption by 8.832 kWh/L. The total energy was then multiplied by a nominal 33% combustion efficiency and a nominal 85% gearbox + chain efficiency to get the wheel energy. Even the faster and less efficient EVs use barely as much energy at the wheels as some of the lowest energy IC Efficiency winners.
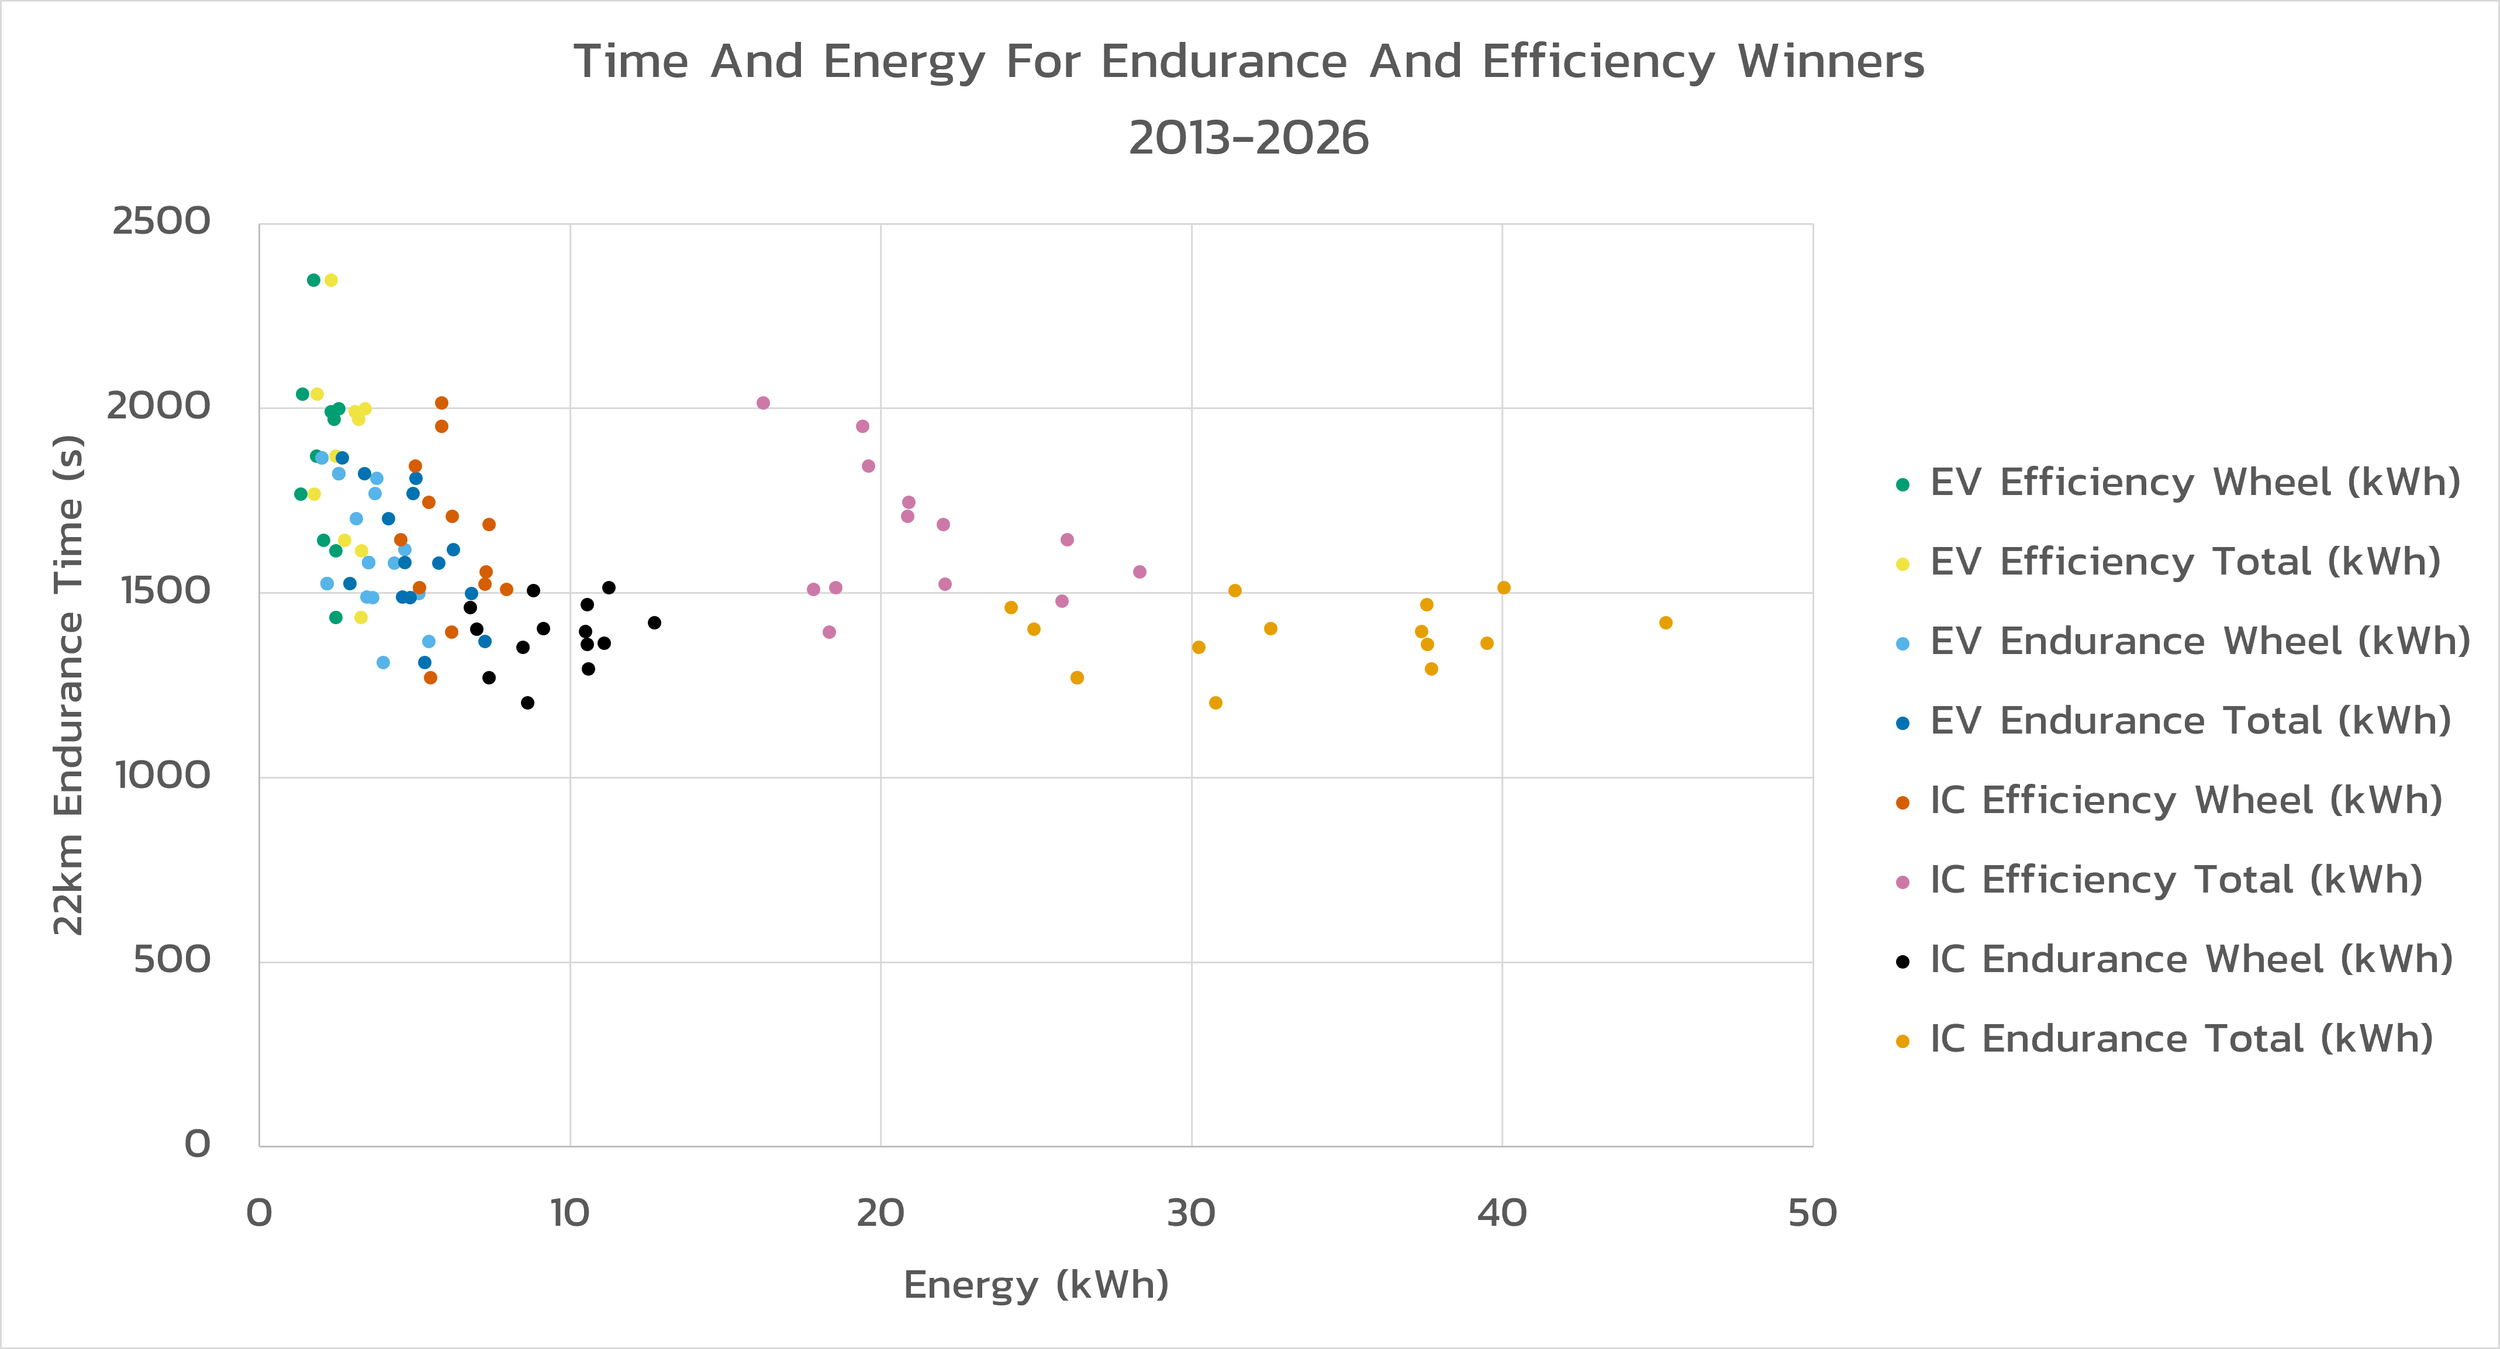
The difference in total energy used (combining at the wheels + losses to heat) is eye opening between EVs and ICs achieving similar performance. EV and IC powertrain efficiencies are the reason putting $1 of electricity into my PHEV saves me $4 on gas, and those prices indicate the cost of a unit of energy is roughly constant across different sources. Unfortunately, it only holds about $1 of electricity.
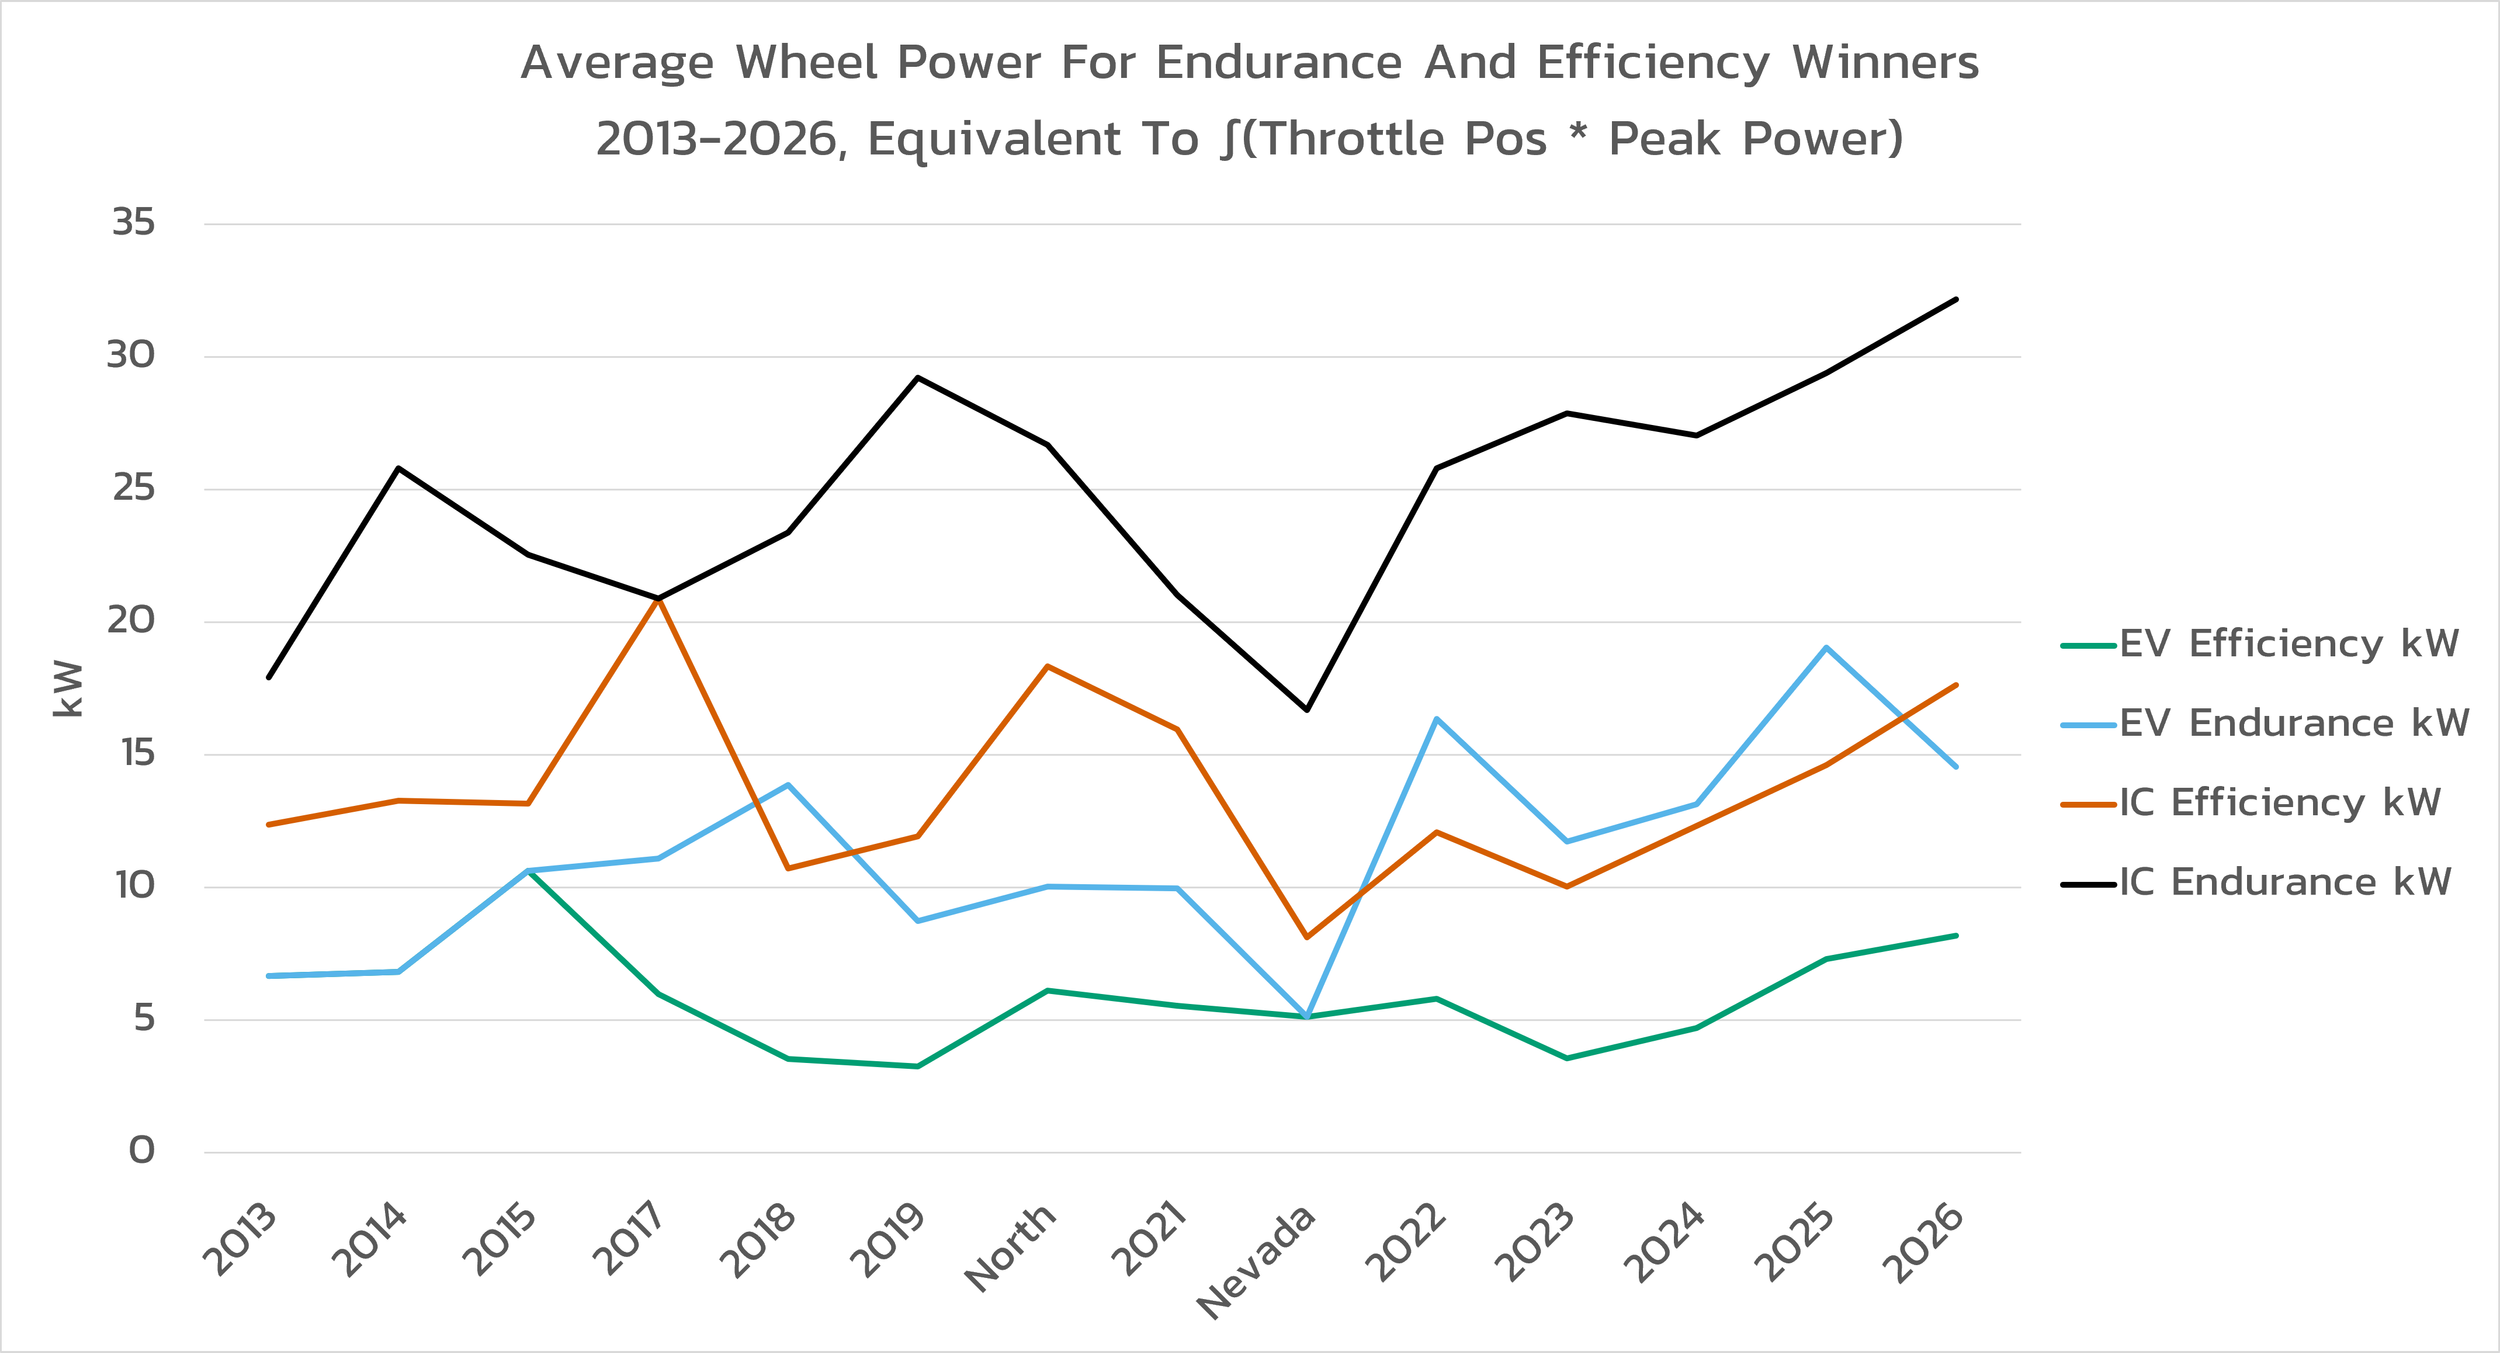
Given estimates of wheel energy and time, average power = energy / time. This is equivalent to taking the integral of throttle position * peak power to estimate average power for IC. Or the integral of the actual recorded motor power for EV. Notice regen, as negative power, will reduce the integral and the average. The energy, power, and speed provided by regen are not revealed by the event totals. You'll have to use the public energy meter data to study that.
With RWD, regenerating 10% of the energy budget is impressive. With AWD, you should be able to at least double if not quadruple that. But even if all of the EV endurance winners had 40% more energy available, the IC endurance winners are using almost twice as much energy at the wheels. (Or not, perhaps 33% combustion efficiency is too high an estimate.)
My intuition is it is possible, but not practical, desirable, or optimal to make a ~12kWh battery and try to drive the car at full performance for the entire endurance event. The drawbacks of a 12kWh battery would probably outweigh the benefits of not having to save energy, assuming it is even possible to avoid saving energy.
endurance budget
You must understand the energy budget for the endurance event. You need to know what uses energy, and how much, so you know if you can finish endurance or not. It is the central problem of the entire competition. If you do not know how the car uses energy over an endurance event, you have not understood the assignment. You need to know what is consuming energy in order to get development priorities in order. How much energy to spend on speed does weight saving gain? Or drag reduction? Or powertrain efficiency, or regen? Finer grained details like rolling resistance or LV energy usage might become significant.
One way to look at the energy total is acceleration + aero drag + cornering drag + powertrain losses - regen accounting for losses. Another way to look at it, because the powertrain losses are a function of the power used, (acceleration + aero drag + cornering drag) / (powertrain efficiency) - (regen * powertrain efficiency).
Simplify and Add Efficiency
EV system efficiency is as important as mass, downforce, drag, power, and mu. EV cars have different trade offs. One of my earliest experiences in EV racing was that a heavier, lower power motor with higher efficiency might result in higher overall performance. Higher efficiency increases the amount of energy the wheels get from the battery. And the efficiency gains or losses are squared considering regen and then deploying the regen energy. Higher efficiency contributes to a faster endurance time, and might even contribute to a faster autocross time when considering the car as a system.
The battery, the controller, and the motor all have their own efficiency. The efficiency of each changes with power. It might change with voltage or state of charge. It might be different charging or discharging. It's a good idea to start with a single number in a lap simulation, then gradually make the look up tables more complicated.
In many aspects of EV racecars, energy management is identical to temperature management. In both cases, coasting at 0 load is incredibly effective. Simulating heat losses is important not just to keep components from overheating, but every inefficiency increases the amount of energy the car needs to finish endurance. Inefficiency wastes energy into heat instead of making the car faster. All the efficiencies are multiplied together into the total losses for the powertrain. Powertrain efficiency = battery % * controller % * motor % * drivetrain %.
Study the entire performance envelope
You need to plot maximum acceleration from 0 to top speed. You need to plot maximum braking from 0 to top speed. You need a graph with corner radius on one axis, and speed on the other. A stretch goal is to plot minimum slalom gate from 0 to top speed, what is the cone spacing?
In IC, your work is done, because you have excess energy to burn staying at maximum performance at all times. In EV, with a limited energy budget, you have to fill in the entire area from maximum performance down to 0. Overlay the maps of battery efficiency, controller efficiency, motor efficiency, and drivetrain efficiency. Conveniently, they are all simply multiplied together. Then you pick where you actually operate in that map.
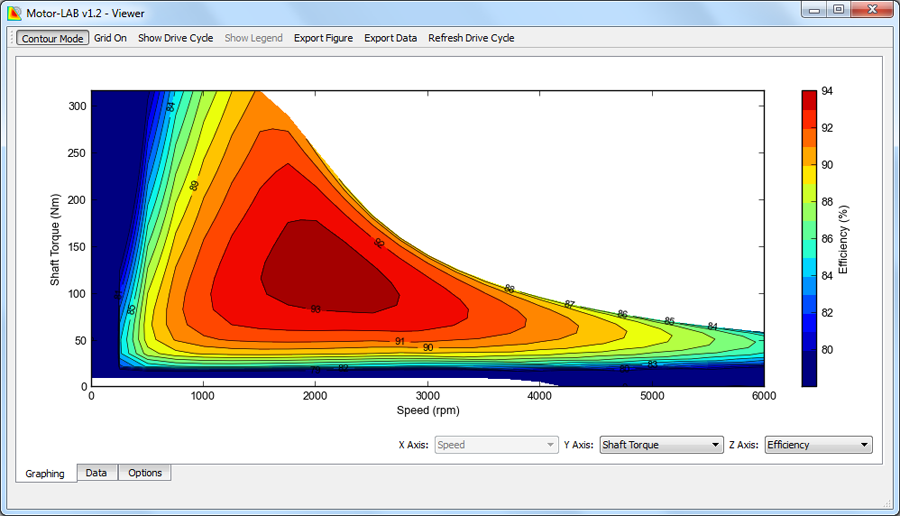
You can get a huge amount of information by using your efficiency map for gear ratio sweeps, including drag power. The gear ratio will determine the usable width of peak power, and the usable width of the efficiency sweet spot. Compared to BSFC maps in IC, the area of maximum efficiency is enormous by electric powertrains, and the contours are not very steep. But when energy limited, the effects of even a small change are more significant.
This is a typical electric motor. There is an area of maximum torque, from 0 to 25% of maximum rpm. From 25-100% of rpm, the torque curve indicates a constant peak power (about 52kW, in this case.) Efficiency is extremely low near 0 torque or 0rpm. The hope is the car is geared to spend very little time near 0rpm, and accelerate out of the inefficient area very quickly, minimizing losses and heat generation. The most interesting thing is how steep the contours are from 91% to 89% efficiency near peak power. 3% more energy is a big deal, especially for a small reduction in power.
Imagine a straight where the car is accelerating from 10m/s to 20m/s, then decelerating back to 10m/s, and we'll ignore traction in this example. An imprecise gear sweep could study the car in 1000rpm increments.
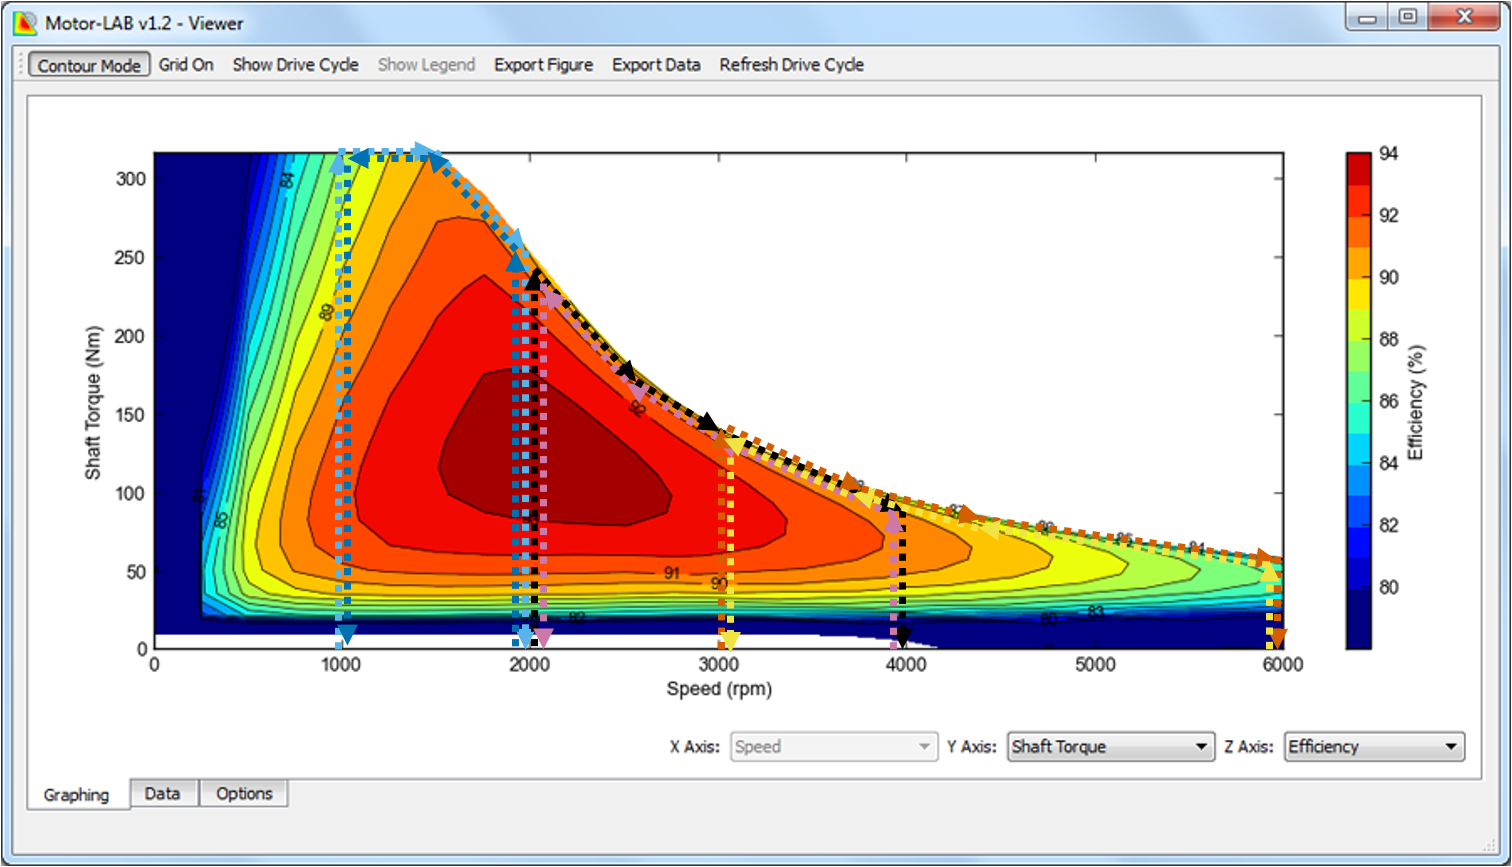
If the car is geared for 10m/s per 1000rpm, the driver goes from 0 to full throttle basically instantaneously at 1000rpm. (sky blue trace.) The car begins accelerating at full torque, 87% efficiency, then 88%, 89%, 90%, and continues accelerating at full power until 2000rpm. Oversimplifying, assume the regen efficiency is identical to the acceleration efficiency. It’s probably quite close The driver activates full regen, basically instantaneously, dropping from full acceleration power to zero torque, then and decelerates at full power. (blue trace.) Starting at 90% efficiency, with efficiency dropping back down to 87% after the car reaches full torque.
If the car is geared for 5m/s per 1000rpm, the driver starts at 2000rpm and goes to full throttle. (black trace, regen trace in purple.) The driver goes to full throttle. It might be smart to strategically limit the controller to the power level where the motor maintains 91% efficiency. But at some point as the car accelerates to 4000rpm, the tradeoff in power might be too great, and the preferred strategy might be to operate at the top of the 90% efficiency contour. Accelerating at peak power is also noticeably faster than accelerating at peak torque below full power.
If the car is geared for 3.3m/s per 1000rpm, the driver starts at 3000rpm. The acceleration (orange trace) and regen (yellow trace) from 3000-6000rpm range from 90% efficiency down to 85% efficiency. The power is the same as from 2000-4000rpm, so the acceleration is the same. And the car also reaches a motor limited top speed at 6000rpm that is probably much too low for FSAE.
Gearing, like everything else, has to consider efficiency and energy in addition to maximum performance.
Feed an efficiency map into your lap simulation. It can be a look up table, it can be a matrix. Then you will be able to calculate how fast the car can go, versus how much energy in will use, in acceleration, braking, cornering, through a slalom. You can start with those individual pieces and stitch them together later to make full laps. Save speed and energy results for every trade off, every sensitivity sweep.
Build an onboard energy delta
Sim drivers should be familiar with the time delta. Trying to improve in every corner. Looking after every corner to see if you're another tenth of a second faster, or still gaining time down the straight from a good corner exit, or a tenth of a second slower, or still losing time down the straight from a bad exit. To maximize EV performance, you need to create an energy delta in addition to a time delta.
The absolute minimum is a good State of Charge estimation, in percentage of energy remaining, displayed next to a percentage of endurance distance remaining, both counting down from 100%. Even if you haven't successfully practiced an endurance, you want at least basic tools for the car to project whether it can finish or not. Radioing the driver to go faster or slow down has a high chance of failure and a low chance of being fast. The next information the driver needs is the usage rate. Then they can see in real time what consumes a lot of energy, and what consumes less energy. In all of these displays, avoid having drivers look at numbers only, or worse, making the drivers do math.
I really like time delta paired with velocity delta - is the current speed higher or lower at this point than your best lap? The ultimate tool would be an energy delta in the style of a velocity delta. At this point in the lap, have you used more or less energy than your best lap? Best is subjective. And should the live comparison be of energy used, or current power usage? Or perhaps even an efficiency readout. The driver could be doing constant comparisons, a 0.1s faster and 0.1% less SoC, or 0.3s down and also used a 0.1 kWh more. You could even build a tool where the car suggests the most beneficial locations to use more throttle, and the most beneficial locations to cruise, coast, regen.
AERO and energy
Article Category Aerodynamics
Wings work exactly The Same As IC
Adding powerful, reliable cooling will probably be more significant than adding wings. Compared to most racing and race car aerodynamics, FSAE is low speed, tight radius, and high yaw. FSAE cars have a short wheelbase, and a high rear wing and drag moment. Wings and other devices add downforce, drag, mass, and polar moment of inertia. What are the dynamic and balance effects in every event, brake, acceleration, skidpad, autocross, endurance, and efficiency? Do not forget the drag moment. The time delta and energy delta need to be calculated and studied over every single part of a lap. Go deeper than totals at the end to the specific moments that enhanced or reduced performance or energy usage. Use that information to guide your decisions where to increase or reduce development.
Can downforce improve efficiency?
This is a question to study with experiments in lap simulation, examining the delta in speed and energy over every part of a lap. In a perfect world, acceleration adds kinetic energy, regen recaptures it all under deceleration, and drags are the only losses. Even with those assumptions, it is uncertain whether downforce will generate more speed for the same energy or not. On the one hand, downforce can increase corner speed, reducing the need for acceleration, regen, and the associated powertrain losses. On the other, generating downforce incurs more drag, and all drag is squared with increasing speed. Can you afford to drag a big wing down the straights, spending energy at the highest rate to generate the highest levels of downforce, when the car isn't even grip limited?
Two mode aero changes everything.
In circuit racing, movable aero is very powerful. In FSAE, your mileage may vary. The 2026 F1 cars should finally lead to much wider understanding of these concepts. With fixed aero, the lift over drag ratio has dominated racing for 50 years. If you developed from a ClA / CdA of 3.0 to 3.5, you were a hero, the car gained whole seconds.
Two mode aero is so much faster. On one program back in 2019, the baseline was ClA 5.2, CdA 1.3, L/d = 4. That's a reasonable fixed aero car. It was significantly faster to have high downforce mode with the same downforce but much higher drag drag, ClA 5.2, CdA 2.6, L/d = 2.0, combined with a 30% lower drag mode ClA 2.0, CdA 1.0, L/d = 2. 30% less drag, 60% less downforce, quote "worse" aerodynamic efficiency. Taking the L/d from 2.0 back to 4.0 in the high downforce and low downforce modes, instead of being worth seconds and a huge amount of energy, it might be worth tenths. L/d was a way to think about both ClA and CdA when the wings were fixed. ClA and CdA are still the main drivers of performance, but it's only a slight exaggeration to say you only need to care about ClA in downforce mode, and you only need to care about CdA in low drag mode.
When the car is traction limited, we want maximum downforce. We don't care about drag because we don't have enough traction to use all the power and energy. In high downforce mode, drag is almost irrelevant as long as the car is traction limited. Drag levels in high downforce mode will have small effects on performance and energy usage. When the car is power limited, we want to minimize drag in low drag mode. Down force is irrelevant when we don't have enough power to use all the longitudinal grip.
I actually want to get rid of all the downforce in low drag mode. Higher downforce and higher L/d for the same CdA costs a lot of time and energy in rolling resistance on long straights. Trade minimal downforce for a fraction of a second longer in high downforce mode while accelerating. (I wasn't revealing that competitive advantage at the time, but it should be obvious to a lot more people now.)
The Influence of Active Aerodynamics on Electric Vehicle Racing Strategy
With L/d almost irrelevant in high downforce mode, it also means any sort of "smart" aero that aims for the perfect angle and downforce level is also irrelevant. You would never be able to measure the gains. We're not trying to control the attitude of an aircraft, we're trying to drive tires into the ground. More load means more grip means faster cornering. Changing the amount of downforce left to right is also irrelevant. Max downforce would be better. If the outside tires are already generating their maximum lateral force, the only way to increase grip and go faster is to saturate the inside tires.
I will hug the first team that shows up with steerable endplates or fins, but they will have to explain why side force isn't as powerful as downforce.
And if aero element efficiency isn't significant, how far could you get without even using airfoils?
Mass, power, downforce, drag, and mu are as important as ever, but things get wild when you start exploring the new dimensions of energy and efficiency.

_(2).jpg)
