
Reverse Engineering Tires
A version of this article was presented at the 2025 FSAE Workshop.
All tire models are wrong. Some tire models are useful. Useful estimates of tire grip can be derived from an accelerometer, speed traces, and some 8th grade math. Recorded data can be used to tune the car. Whether deriving a simple vertical load estimate, or a more sophisticated slip angle estimation, a real time calculation can be used on the car for ABS, for torque vectoring, and for the driverless event.
Tire Forces
Despite rolling and deforming and slipping, a racing tire can hold about the same force for accelerating, braking, and cornering. All of these forces are called grip. Grip comes from both friction and adhesion between the tire contact patch and the road surface.
Graphing the lateral and longitudinal acceleration of the whole car is called a G:G diagram, or friction circle, or traction circle, or performance envelope. If all of a tire's grip is being used for acceleration or braking, there is no grip left for cornering. If all of a tire's grip is being used for maximum cornering, there is no grip left for acceleration or braking.
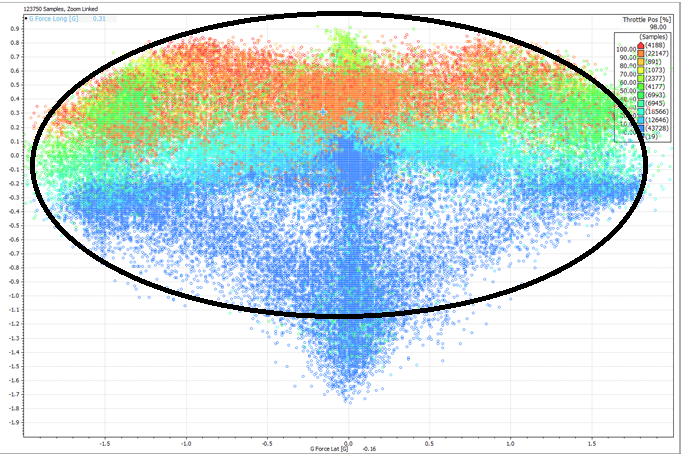
The X-axis of this scatter plot is lateral acceleration, left-right. The Y-axis is accelerating (up) and braking (down), fore-aft. The color scale is from 0 throttle (blue) up to full throttle (red). The lowest point of the graph is maximum braking G. It comes from both tire grip and aerodynamic drag, so it is outside the circle or ellipse.
The maximum grip a tire can generate is the function of many factors not covered here, such temperature, inflation pressure, camber, and chemistry. From simple sensors, the vertical load and slip angle at each tire, and their effects on grip, can be estimated. The more vertical load is on a tire, the more grip it can generate, as a multiple of the vertical load. But the more the vertical load increases, the grip available will be a smaller and smaller multiple. This characteristic is called load sensitivity. Eventually, the tire grip stops increasing, even if vertical load continues to increase. There is a maximum force that a given amount of rubber can create.
How Suspension Tuning Works
As the lateral forces on the front and rear tires increase, a car corners harder. When the grip stops increasing, the car can't corner any harder. Suspension tuning uses the effects of vertical load to control whether the front outside tire or rear outside tire reaches its maximum possible grip first.
Increasing spring rate, anti-roll bar rate, roll center height, or damper stiffness on one axle always:
Increases the roll stiffness of that axle.
Increases (stiffens) the roll moment reacted by that axle.
Reduces (softens) the roll moment reacted by the other axle.
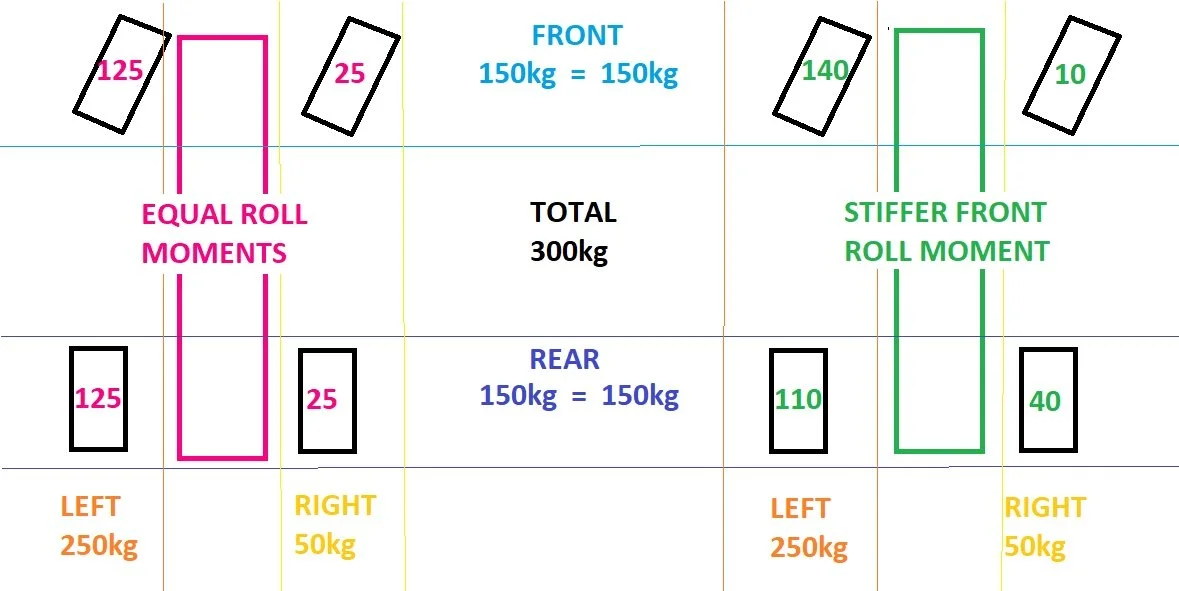
No suspension design can reduce load transfer inside to outside. Or front to rear. In the examples above, two 300kg cars are cornering right, with no drive or braking. The cars have a 50:50 balance, so front axle load is always 150kg total. The rear axle load is always 150kg total. For a given cornering G, the load on the outside tires is 250kg for both cars, and the load on the inside tires is 50kg. The example on the left has equal front and rear roll stiffness. The vertical load on the front and rear tires increases to the outside and decreases to the inside at the same rate as cornering increases. The front and rear tires reach their grip maximum at the same time, and the car cannot corner any harder.
The example on the right has higher front roll stiffness. As cornering increases, the split between the front tires increases faster than the split between the rear tires. The front outside tire will reach its grip maximum first, and at that instant, the car cannot corner any harder.
For four otherwise equal tires, the example with higher front roll stiffness will have less front grip and more rear grip than the example with equal front and rear roll stiffness. The higher the tire load, the lower the mu. The lower the tire load, the higher the mu. The higher the load split between two equal tires, the less total grip is available. The lower the load split between two equal tires, the more total grip is available. The example with higher front roll stiffness will have a lower peak cornering capability than the car with equal front and rear roll stiffness, because the outside front tire reaches its grip maximum first.
Suspension tuning uses changes in roll stiffness to control whether the front or rear outside tire reaches its grip limit first, and how quickly. The chassis torsional rigidity carries a difference in load split from the front rocker posts to the rear rocker posts.
Calculating Brake Force
Calculating brake force during a race is typically done by logging hydraulic brake pressure and regen power. A fancy IC model would use powertrain rpm to calculate and add in engine braking.
The calculations from pedal force to tire force are well known. Starting from hydraulic brake pressure, which is in the middle:
brake_line_pressure * cylinder_area = cylinder force
( front_cylinder_force + rear_cylinder_force ) / pedal_ratio = driver_pedal_force
Moving in the other direction, hydraulic brake pressure allows the calculation at the braking force at each tire:
brake_line_pressure * sum_of_piston_areas = clamp_force
clamp_force * pad_mu = friction_force
friction_force * average_rotor_diameter = wheel_torque
wheel_torque / tire_radius = tire_braking_force
When a tire is locking excessively, the upper limit of the braking torque is the kinetic mu of the tire.
Calculating Drive Force
A good starting estimate in an IC is:
IC_Engine_Power * throttle_% * drivetrain_eff% / vehicle_speed = axle_force
Think in terms of power, not torque. Using a torque curve instead of a power curve requires a different factor for every gear. For a given RPM, power at the crank is the same as power at the wheels plus drivetrain losses in every gear.
If you know the engine RPM, you know the power, and you divide by vehicle speed to get the acceleration force. If the engine power was measured on a chassis dyno, the power is already at the wheels, after all the drivetrain losses.
EV drive force can be calculated the same way using a dyno curve. Alternately:
battery_power = battery_voltage * current
battery_power * inverter_eff% * motor_eff% * drivetrain_eff% = axle_power
axle_power / vehicle_speed = axle_force
80kW Drive, 80kW Regen

At low speeds, drive and regen forces will be limited by a combination of maximum longitudinal grip, and maximum motor torque. The force for a constant power is asymptotic at 0, and decreases exponentially with increasing speed. At the same time, if a car has aerodynamic downforce, the vertical load is increasing exponentially with increasing speed, increasing longitudinal grip until until maximum tire saturation or top speed is reached.
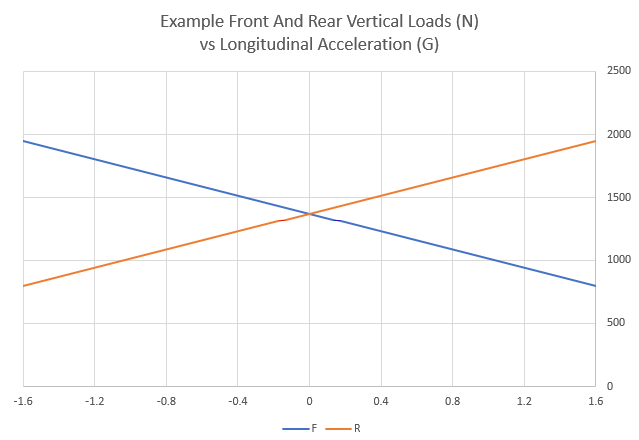
Under drive, the higher the drive force, the higher the load transfer to the rear, the higher the power the rear motors can deploy. The higher the braking or regen force at the tires, the higher the load transfer to the front, the higher the brake rotor or regen power can be used at the front.
Drag Effects
For many race cars, the height of the Center of Pressure in front view is approximately the same as the height of the Center of Mass. FSAE aero cars are weird. They have huge rear wings very high above the center of mass. This creates a moment and load transfer from pure drag:
0.5ρ CdA v^2 * ( CoP_Z – CoM_Z ) / Wheelbase
It is important to be aware of drive force that is accelerating the car, and drive force that is overcoming drag. Total drive force creates load transfer that is higher than the load transfer resulting only from acceleration G.
With no throttle, drag creates deceleration G. With no braking or regen, deceleration from drag does not create load transfer. Only CoP_Z /= CoM_Z allows drag to create load transfer. Once that is accounted for, only mechanical braking, regen, and drive forces cause longitudinal load transfer.
Reverse Engineering CdA
Every car has aerodynamic drag. Drag force is ½ *air_density*Coefficient_of_drag*Frontal_Area*velocity^2
0.5ρ CdA v^2
Traditionally, drag is measured with a coastdown test. No brake torque, no drivetrain torque. The deceleration is a result of both aerodynamic drag and rolling resistance. Rolling resistance is pretty constant with speed, a coefficient Crr * normal_force. Rolling resistance increases with vertical G, and with downforce. If no downforce or vertical G loading is present, then rolling resistance can be estimated as a constant force, and the deceleration change with the square of speed as the result of aerodynamic drag. If the car has downforce, then the rolling resistance is still a function of the total rolling resistance on the car, with downforce effects essentially squared with speed.
Alternately, brake and drive forces can be used to derive CdA. A sensible estimate below was created using only throttle position * vehicle peak power, not even the better estimate that would come from referring to the power curve and rpm.
power / speed = longitudinal_force
power / speed = mass * acceleration + 0.5ρ CdA v^2
It's noisy, just a quick check to start validating CFD estimates. The CdA is in the stable region on the straights. The calculation does not work at all when the car is not both going straight and on flat ground. Otherwise power is going into cornering drag or added or subtracted by elevation change.
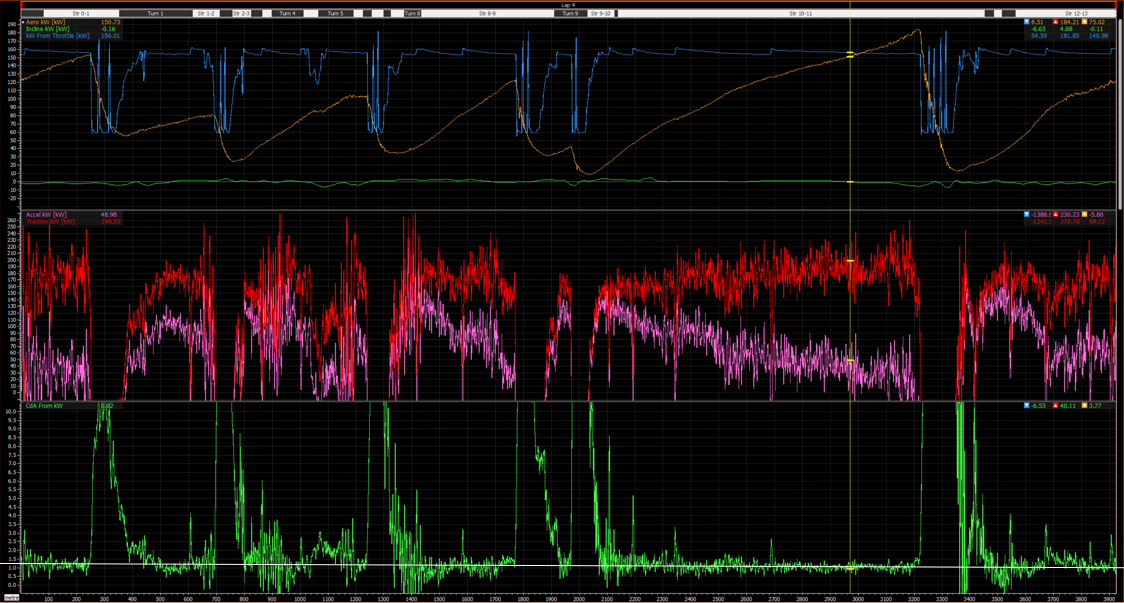
blue: throttle * peak power
orange: speed
pink: power consumed by acceleration, noisy accelerometer
red: acceleration power plus drag power calculated from CFD
accel + drag power is increasing slightly, indicating the CFD drag is too low
green: derived CdA
white: estimated single value from derived CdA
Real Time Dynamic Load Estimation
Article Category Low Voltage / Data Acquisition
An app on a cheap phone can be your most expensive sensor. There is zero excuse to not have this level of data collection, simply under the driver's suit, every time the car is driven. The information required to start vertical and lateral tire load estimation is:
Lateral acceleration
Longitudinal acceleration
Speed
Static corner loads
CoM Z height
Wheelbase
Track width
Load Transfer Review:
Load transfer is reacting a moment created by the height of the CoM above the contact patches where the tire forces are happening. A G sensor logs the total acceleration from drag deceleration, mechanical braking, and regen. Using G instead of tire forces to calculate longitudinal load transfer will result in an estimate that is too high under braking (due to drag), and too low under acceleration (due to the powertrain overcoming drag.)
Drive transfers load from front to rear axle, meaning more rear grip.
(drive_force*CoM_Z)/wheelbase
Braking transfers load from rear to front axle, meaning more front grip.
(braking_force*CoM_Z)/wheelbase
Cornering transfers load from inside to the outside tires.
(M*A*CoM_Z)/track_width
Anti-squat, anti-dive, roll centers do not change total load transfer. They do affect total movement. Antis and damper tuning are felt when the suspension is moving. Higher antis reduce how much of the load transfer goes through the springs, dampers, roll bars. Load going through (supposedly) non-compressing links instead of springs makes the suspension stiffer, and the load transfer finishes faster.
Reverse Engineering Vertical Load
Static corner loads
Apply combined lat / long load transfer
Not including drag deceleration in braking
Add downforce, account for drag moment
Nice future steps:
Account for suspension roll stiffness
Dampers and pitch/roll acceleration
Vertical G compensation
Bumps (suspension travel)
Lateral tire force is estimated from lateral acceleration. Lateral_acceleration * car_and_driver_mass is the total lateral force. In steady state, the percentage of lateral force on the front tires is the same as the mass percentage on the front tires. The front tires accelerate the front of the car around a corner, and the rear tires accelerate the rear of the car around the corner.
Estimating the load split between left and right tires involves factoring in load sensitivity. The majority of the difference between the inside and outside lateral force is proportional to the inside and outside vertical loads. The lateral force on the lightly loaded inside tire is capped by the peak mu of the tire. The lateral force on the heavily loaded outside tire is capped by the maximum lateral capability of the tire for a given load.
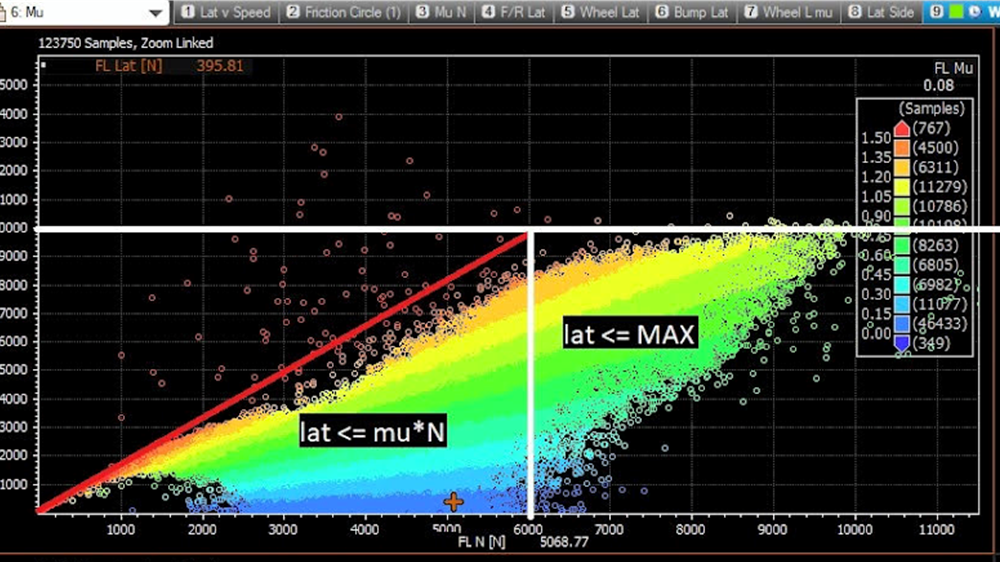
The X-axis on the graph is estimated tire vertical load. The Y-axis on the graph is estimated tire lateral force. The color code is a lateral mu calculation from 0 (blue) to 1.5 (red). There is a clear plateau where even though tire vertical load increases from 7kN to 10kN, tire lateral force stays right around 10kN. There is a maximum mu and slope near 0 vertical load of about 1.5. If the tires are reaching the plateau, a four tire model with even an extremely simple tire estimation with a linear mu until a constant maximum lateral force allows you to begin the study of mechanical balance and aero balance. If the car is not maxing out its tires, drive harder. And a more precise load sensitivity curve will be needed.
How Fast Can You Go Around A Corner?
Article Category Vehicle Dynamics
Based on the maximum lateral acceleration from the traction circle, centripetal_acceleration = ( velocity ^ 2 ) / radius, the maximum speed around a corner is:
square root of ( max_lateral_acceleration * radius ).
But I think an even better way to think about it is, at the current speed, throttle, and brake, what is the minimum radius the car can achieve?
min_radius = ( velocity ^ 2 ) / max_lateral_acceleration
When you go off the track on the outside of a corner, or even miss an apex, if you were at the maximum lateral acceleration of the car, then going off line was not caused by understeer or oversteer. You were simply never going to make the corner at that speed.
A better calculation of the minimum radius would use an estimation of the grip at each tire.
lateral_grip_per_tire = sqrt ( grip ^ 2 – longitudinal_force ^ 2 )

Understeer Calculation
Understeer (noun):
Front tires have a higher slip angle than the rear tires.
Front tires are closer to -or past- their peak grip.
Oversteer (noun):
Rear tires have a higher slip angle than the front tires.
Rear tires are closer to -or past- their peak grip.
Calculating understeer requires a steering sensor, in addition to lateral acceleration and speed. From the steering sensor, the outside front tire steering angle must be calculated in radians. The inverse corner radius 1 / r must be calculated from lateral_acceleration / ( velocity ^ 2 ). Then understeer is calculated by subtracting the angle of the tire from the neutral steer angle of the outside tire.
Understeer [rad] = wheelbase [m] * inverse_corner_radius [1/m] - outside_front_tire_angle [rad]
Convert the result from radians to degrees. A negative value is degrees of understeer. A positive value is degrees of oversteer.
Note, wheelbase * inverse corner radius is calculating an angle in radians using the small angle assumption. FSAE, autocross, karts, rally, and drifting are weird. The angles are so high, there are significant errors from using the small angle assumption instead of using real trig to calculate the outside front tire neutral steer angle.
But What Are The Total Slip Angles?
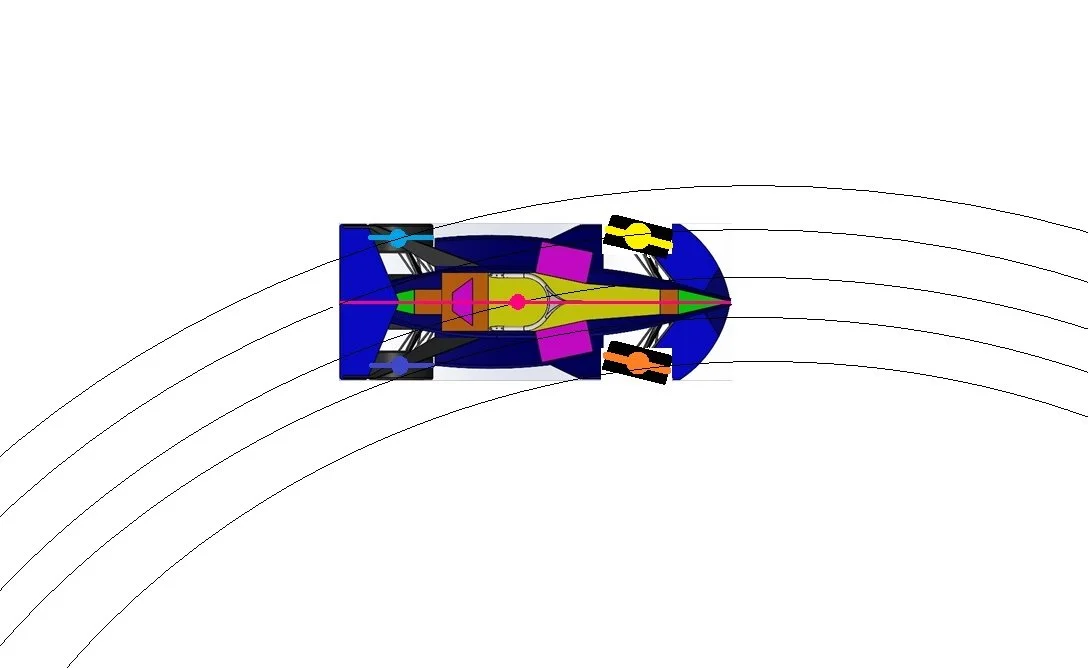
Note in the image above, the four tires and the center of mass all have different angles compared to the tangent of the circular path the car is following. To tangentially follow 100m of a circular path at a chassis beta angle of 5 degrees:
The chassis travels 99.6m longitudinally
The chassis travels 8.7m laterally
The car rotates 100m/(2*pi*radius)
Slip Angle Creates Lateral Force

If a tire is not sliding sideways, it is not generating lateral grip.
The understeer calculation says nothing about the rear slip angles, only the difference between the outside front and outside rear slip angle. A yaw rate sensor is required to estimate the chassis beta angle used to calculate the total front and rear slip angles.
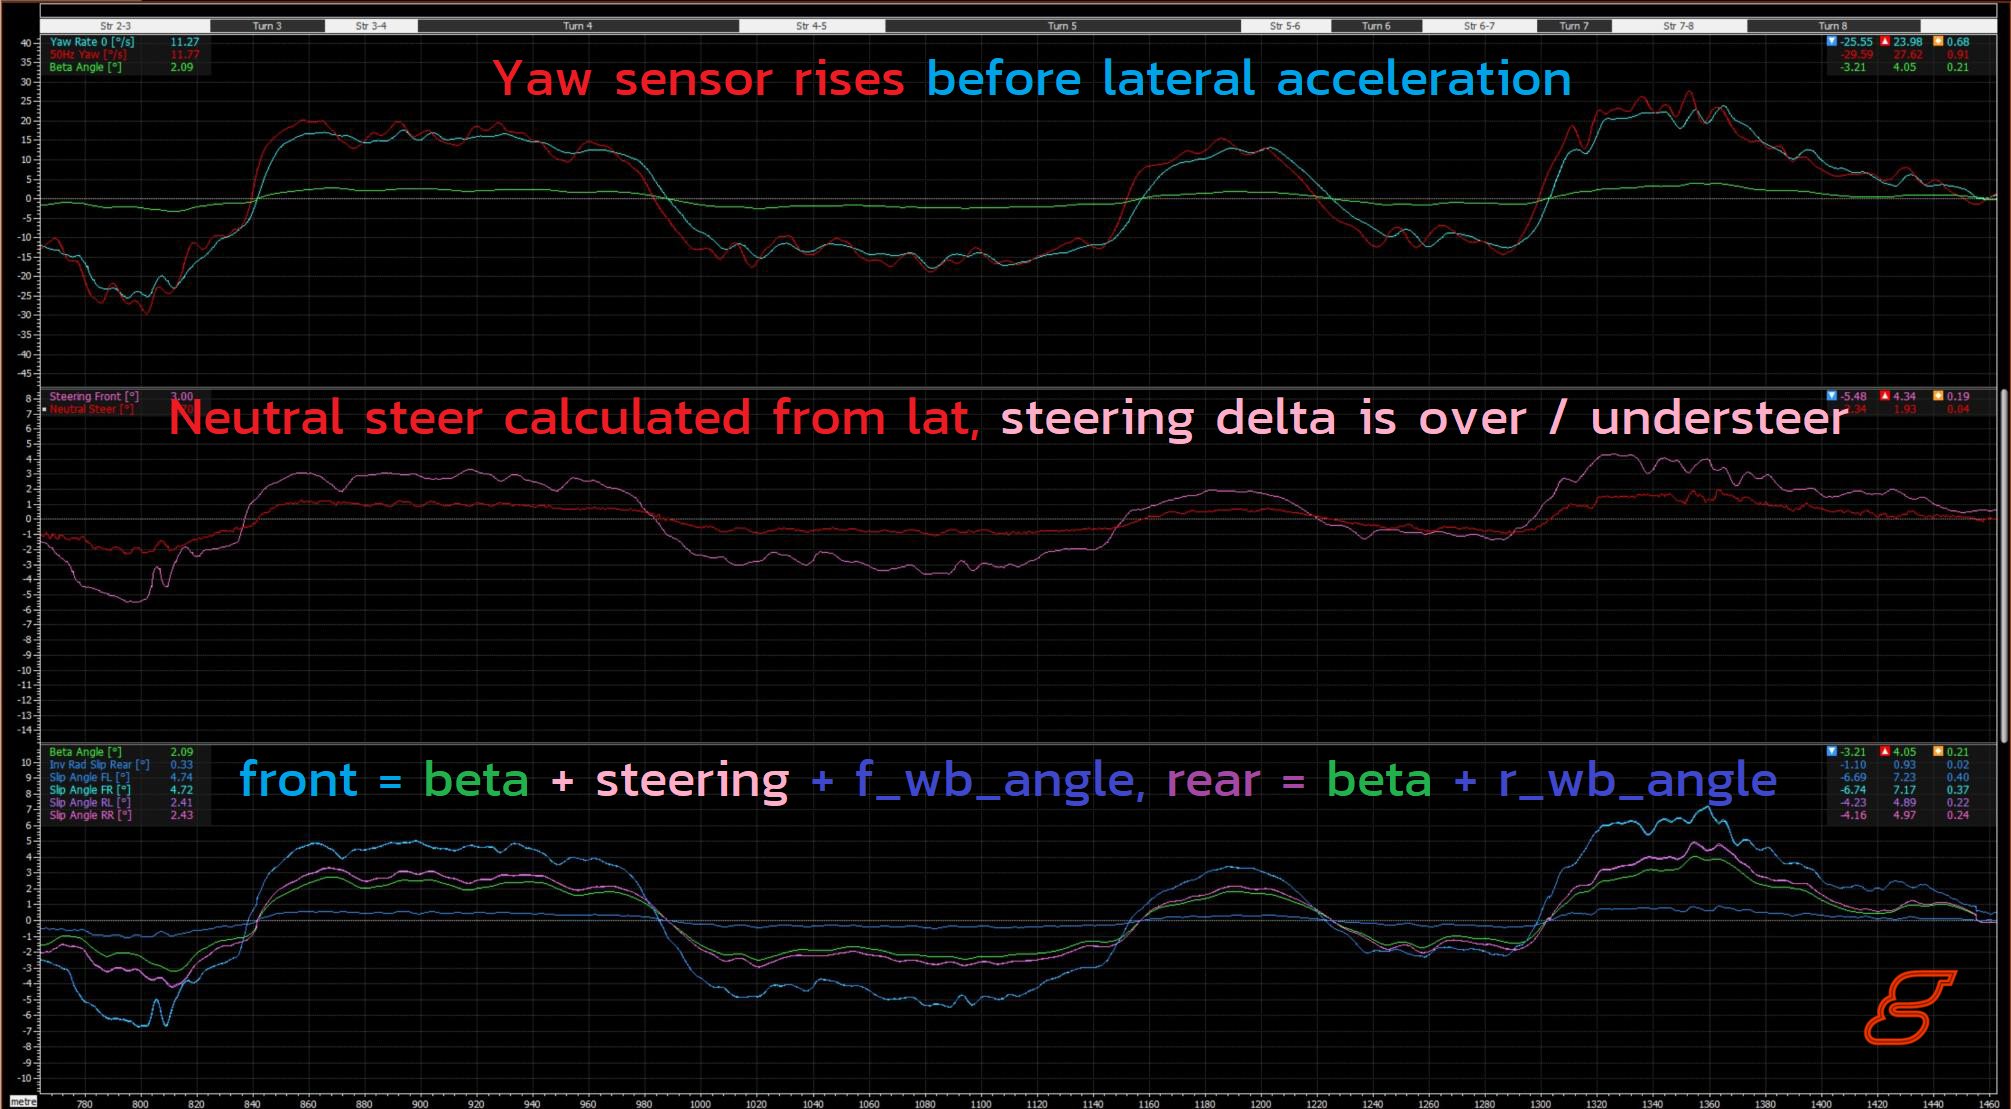
First, this shows the chassis yaw rate (red) and lateral acceleration (sky blue) from a driver in the loop simulation through a sequence of six corners. The yaw rate rises before the lateral acceleration.
Steering the front wheels creates a front slip angle
Creates a front lateral force
Creates yaw rate
Creates a rear slip angle
Creates rear lateral force
Creates lateral acceleration
Then the neutral steer angle (red) is calculated from the lateral acceleration. The delta to the front tire steering angle (pink) shows the degrees of understeer or oversteer. Third, the chassis beta angle (green) has the front tire steering angle added, plus arctan ( front axle to CoM / corner radius) (blue), to calculate the average front slip angle (blue, sky). Chassis beta angle (green) plus arctan ( front axle to CoM / corner radius) (blue) is the average rear slip angle (pink, purple). An individual slip angle was calculated for all four wheels, but before static toe is accounted for, the differences between left and right tires are practically invisible on a road course. That would be oversimplifying for FSAE, autocross, karts, rally, and drifting. The smaller the radius, the higher the chassis beta angle, the more the left and right slip angles will diverge.
This took a little bit of Calculus 1. The chassis beta angle is an integration of ( measured_yaw_rate - yaw_rate_from_lat_accel ). Yaw rate is calculated from lateral acceleration via velocity / radius. Inverse radius is convenient here too.
Slip angle calculation on a real car.
The example above makes it look easy, because the simulation is mathematically consistent. It takes some strong secret sauce to get any car's noisy sensors and calculations to play nicely. As well as efficiently translating beta into four individual tire slip angles.
Use frequent calculation resets.
Slip angle (top) should be shaped like Lateral G (bottom)
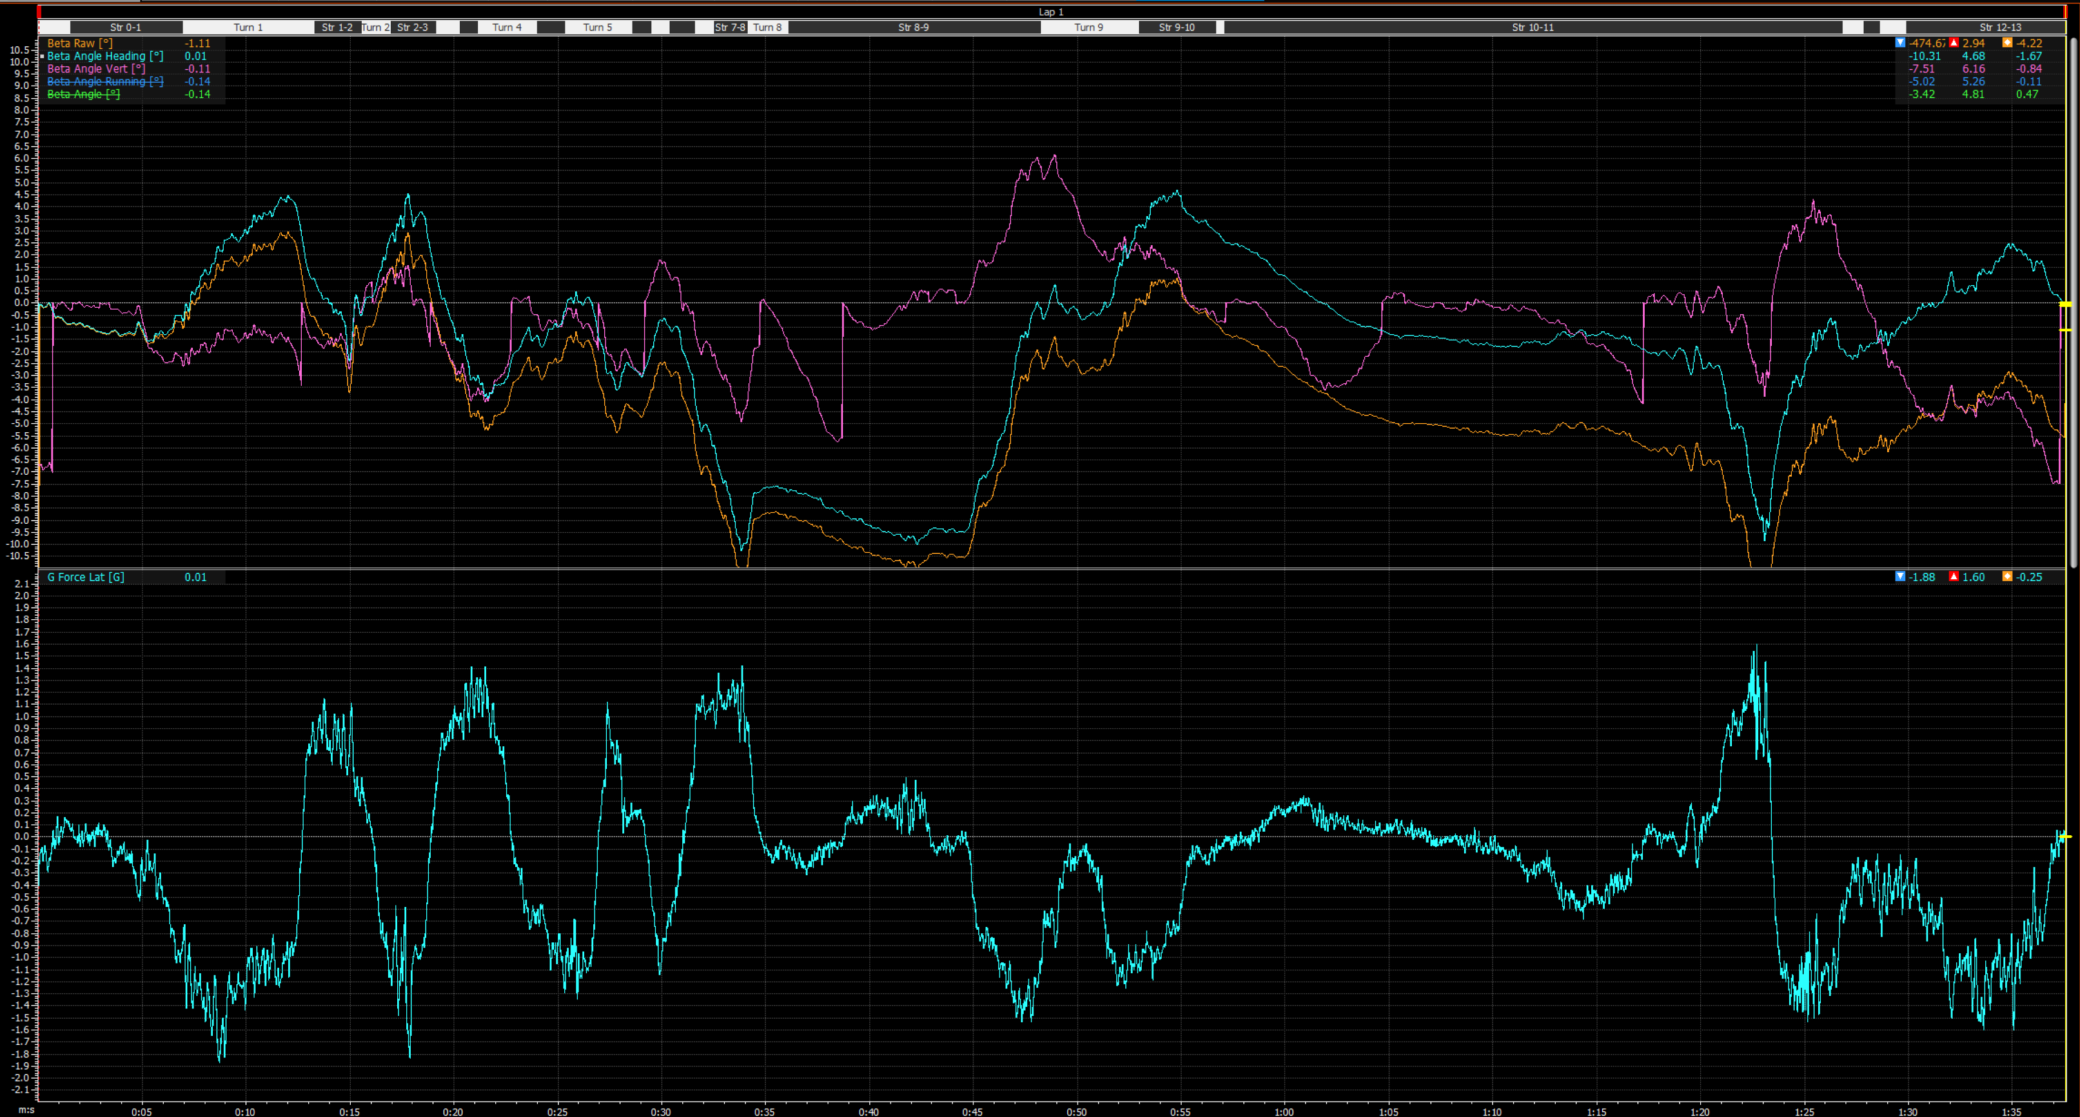
Three failed attempts (of many) to derive slip angle.
All Slip Models Are Wrong,Some Slip Models Are Useful
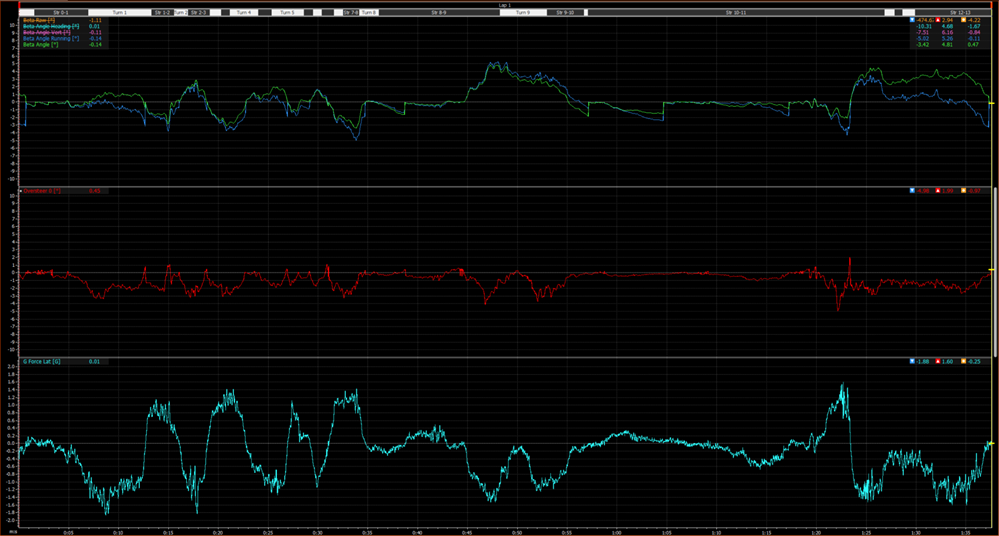
As of summer 2025, in some areas the real-time slip angle estimation (green) was working better than the post processed slip-angle estimation (blue). Do not expect this process to be like living in a simulation.
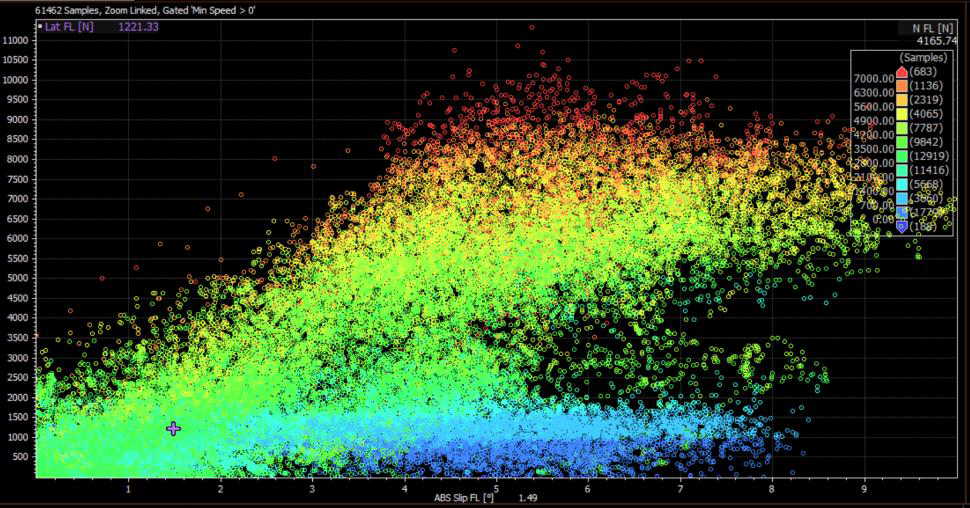
A scatter plot of estimated slip angle on the x-axis and estimated tire lateral force on the negative y-axis, with a color scale from the estimated normal load, gives a model of the tire from track data that matches well with laboratory tire testing. I suggest using slip angle to explore the relationship between tire grip and the velocity of the contact patch over the ground.
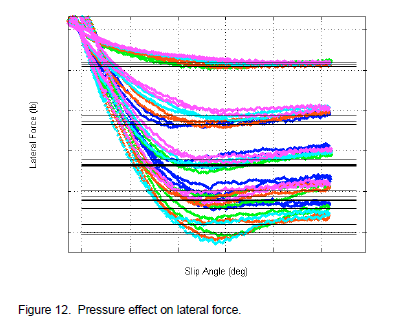
Kasprzak, SAE 2007
Alternate Slip Angle Calculation
I haven’t pulled this version off yet. Slip angle creates both a lateral and longitudinal force on the tire. The longitudinal force is cornering drag. It requires power to travel at a constant speed around a corner. EV teams know their power usage very well.
force = power / velocity
Subtract out aero drag (use the yaw CdA).
Subtract out rolling resistance.
Longitudinal and lateral force trigonometry will give the average slip angle.
How fast can you go around a corner?
The minimum radius calculation can take every piece of tire information you have into account: vertical load, slip angle, temperature measurement or energy estimation, pressure effects, pitch and roll estimates from camber, and whatever else can be simply modeled in a look up table.
Be careful with how noisy accelerometers are when applying real-time controls. I'm not sure what will best suit a given car, but it's not 50hZ, much less 200hZ. The ride frequency might be a better starting place.
Yaw acceleration comes from unbalanced lateral forces. Or a left-right split in longitudinal forces. The next series of questions is:
How quickly can the radius be tightened?
How much yaw velocity can you create?
How much yaw acceleration can you control?