
Analyzing Driver Data
A version of this article was presented at the 2025 FSAE EV Workshop.
The best sim is the one you export data from. iRacing, Assetto Corsa, Automobilista, Project Cars 2, VI-Grade, ChassisSim, and others will directly export driver in the loop data. The driver is in the loop whenever they are controlling discrete inputs to the simulation in real time.
Simulations are test sessions. Every single run on the sim, export data and record comments. You can use these sims to test design choices on the driver like visibility, display readouts, steering speed and weight, control mapping and event start sequences, even yaw acceleration tolerances. If the results from the sim are a good match for results from a real car, you can work on suspension tuning, and go as far as basic vehicle architecture: wheelbase, track width vs. load transfer vs. slalom width.
But you can start simply by comparing drivers. I usually work in Motec professionally, and for my own sim driving. Plot variance, speed, throttle, brake, and steering. Use track distance on the horizontal axis, not time. This lines up all the corners in the same place on the graph. Using time on the horizontal axis would spread the corners out based on lap time differences, and make comparison basically impossible. You will probably need to fine tune the track definition to define the start and end of every straight, and the start and end of every corner. Recognize Spa from the speed traces? In any case, it’s a good practice to keep a track map visible.
Time variance is how much of a time advantage or disadvantage there is at that point on the track between the laps being compared.
The color coded reference lap is a fast sim racer driving this sim and car and hardware for the first time.
The white traces are a beginner driver.
The green traces are me.
From left to right, the green variance graph shows me going half a second ahead, then falling a second behind. I gradually gain a couple of tenths back, then almost pull even, then fall back to a second behind again. I lose a few tenths, gain a few tenths, and end the lap 0.7s behind.
From left to right, the white variance graph shows a beginner gradually falling further and further behind to finish 4.8s behind the reference lap.
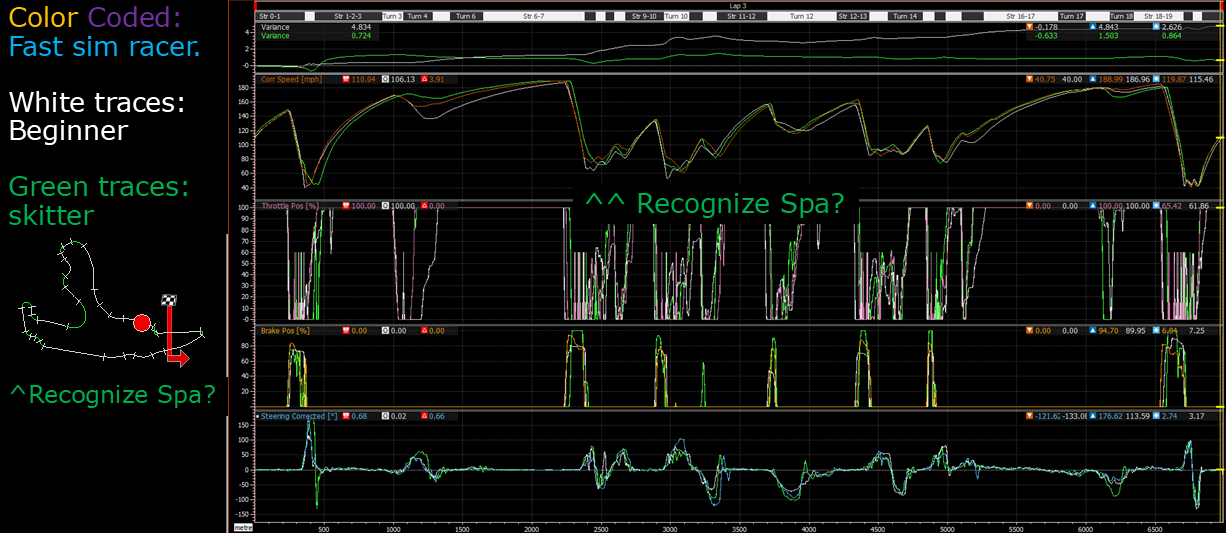
Recognize Spa?
Let's take a closer look at where I did better or worse. Follow the steep parts of the variance graph. I'm ahead, and then behind at Turn 1. I brake later, then spend a long time at minimum speed. Totally blew it. I nailed Eau Rouge, but the percentage speed difference is lower in a high speed corner, so the percentage gain is lower. At the end of the Kemmel Straight, I brake later, but have to go to a lower minimum apex speed, cancelling out any gains.
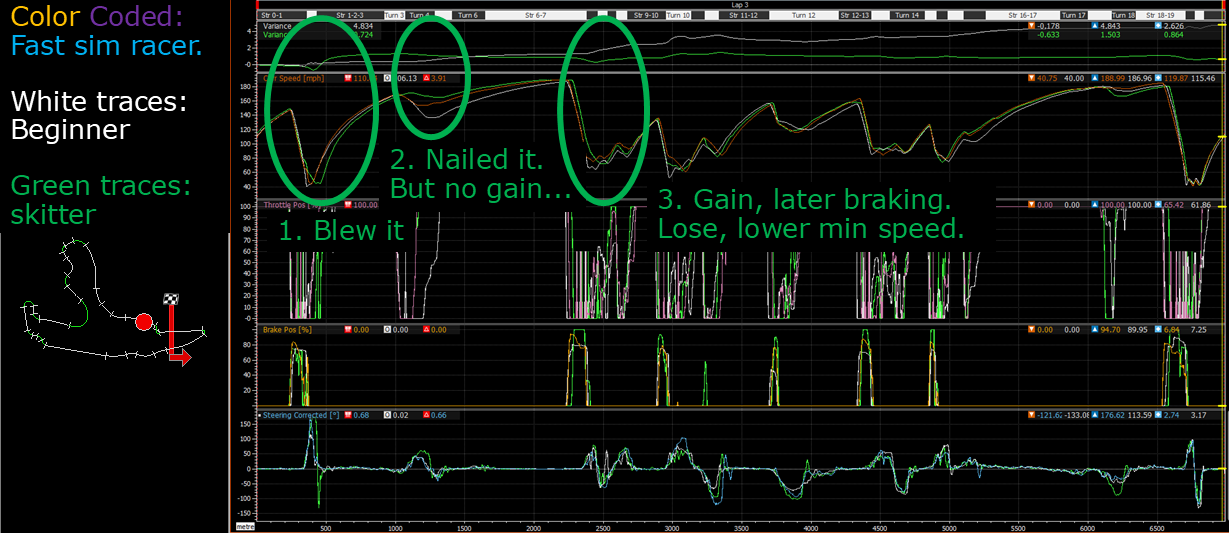
Blew it. Nailed it, but no gain. Gain, later braking. Lose, lower minimum apex speed.
Zoom in further on Turn 1. I come all the way off the brakes, and then have to reapply them. The steering trace also says I came in too hot, and am struggling to turn. I apply the throttle much later than the other drivers. And even then, I am too early on the throttle, oversteer, and have to lift and countersteer because I'm way overdriving.
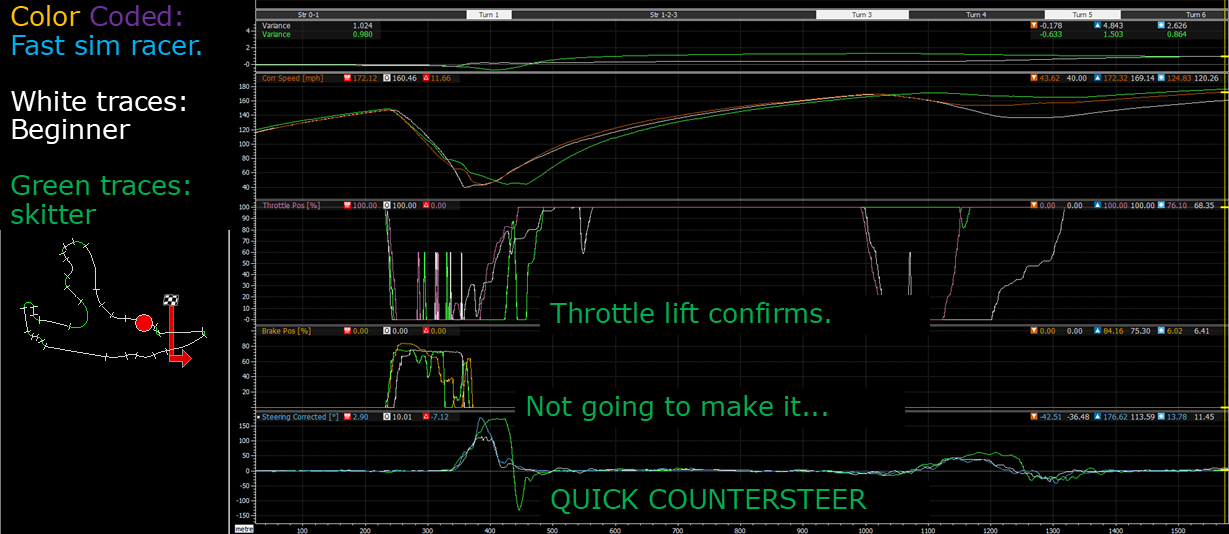
Not going to make it. Back on the brakes. QUICK COUNTERSTEER. Throttle lift confirms I was too early on the throttle.
By seeing what another driver is doing to go faster, you can immediately go back to the same corner with a new, better plan. At Blanchimont, a very high speed corner, I'm overdriving again. I make a big lift off the throttle and try to throw the car in with lots of steering. Just knowing it's possible to go basically flat and use less steering will change how I drive that corner.
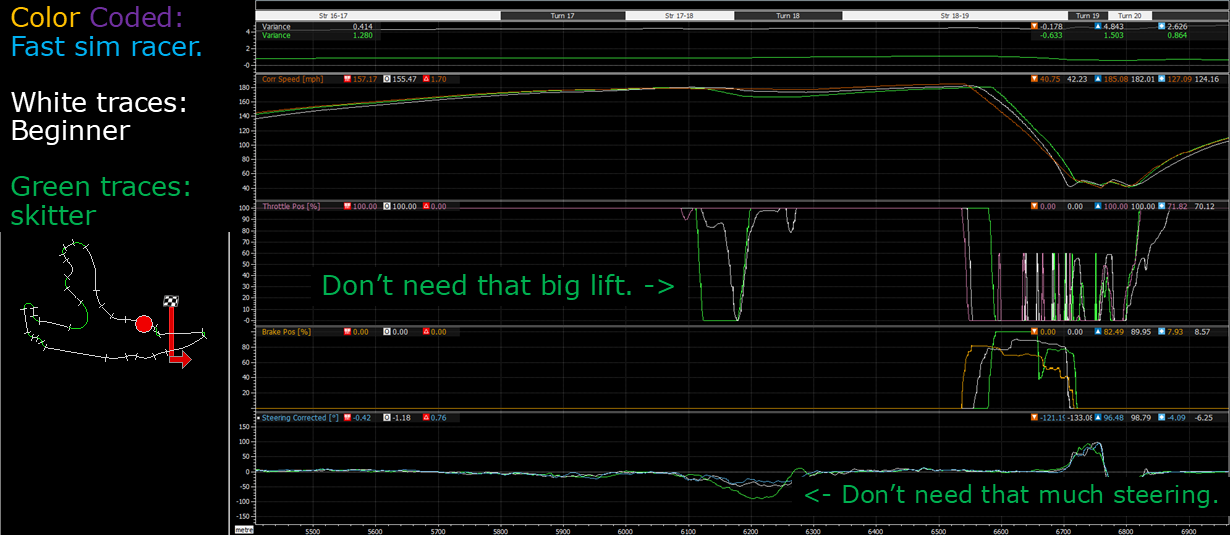
Don’t need that big lift. Don’t need that much steering.
We can attempt to characterize driving with other measurements. The derivative of yaw rate is the best way I've found to quantify "twitchiness". Beta is the angle of the chassis relative to the path, i.e. how sideways is the car. (What’s shown in the next graph is actually the derivative of the chassis angle.) Steering derivative is how fast the steering wheel is moving. From this graph, and from the analysis so far, I would argue my driving is making the car twitchier. And that I am sliding the car more. And generally sawing at the wheel more. A reasonable person can argue these graphs are noisy to the point of unintelligible.
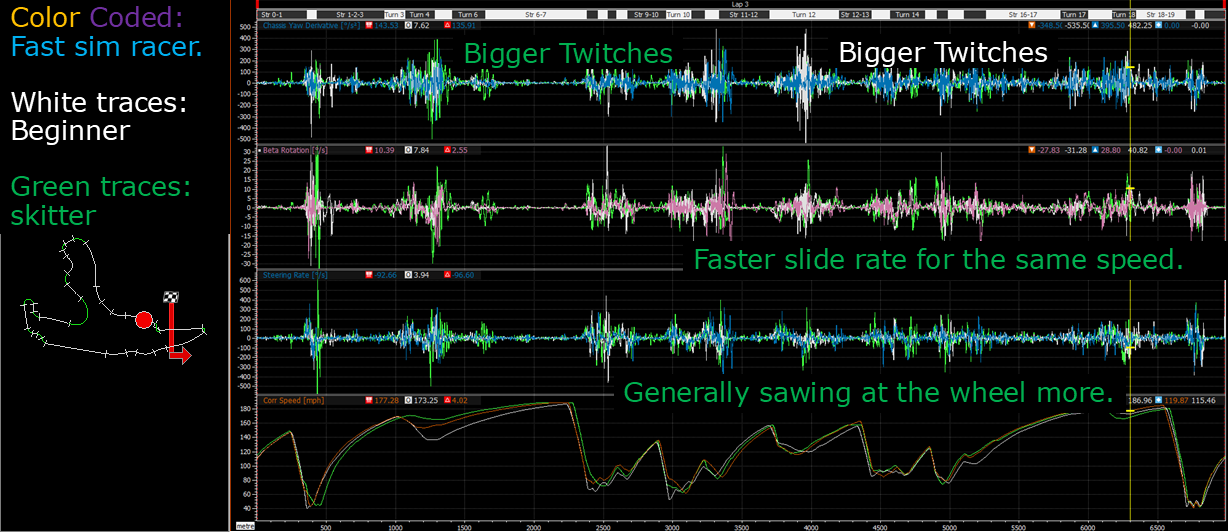
Bigger twitches. Faster slide increase for the same speed. Generally sawing at the wheel more.
Plot everything against everything
Whenever you make a new channel, make a scatter plot against every other key channel: accelerations, yaws, angles, loads, control inputs, suspension. Most of these plots will be blobs with no useful information. Same as with the traces from the start to the end of a lap, you're usually not looking at the whole graph at once. You're looking at specific interesting places on each plot. Be selective and use good judgment to focus on the most useful plots.
Change the horizontal axis from lap distance to speed. Now it's much easier to see the higher chassis Beta angles from my driving. I'm definitely sliding the car more.
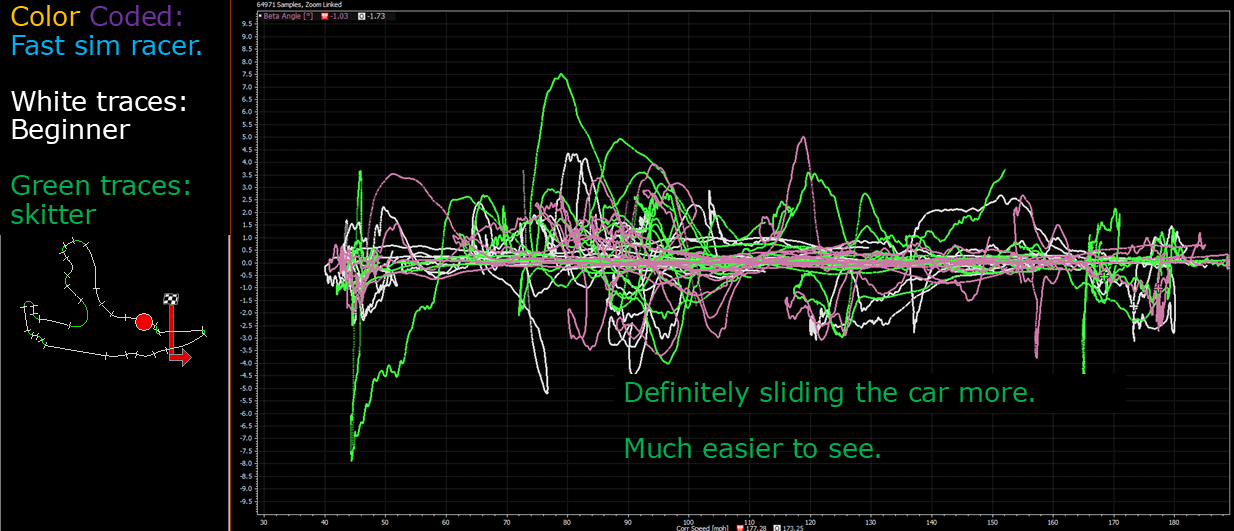
Much easier to see I am sliding the car more.
Plotting Lateral G against speed not only shows different speeds for the same corner, but also aero effects. The faster the corner, the more downforce, the more grip, the higher the cornering G.
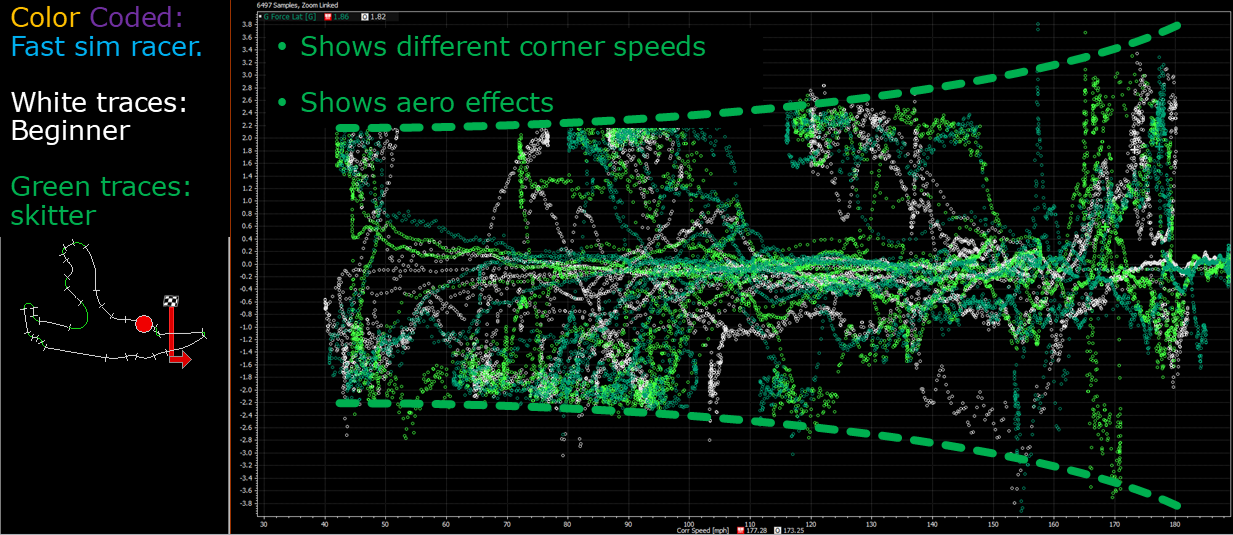
Shows different corner speeds. Shows aero effects.
Plotting Longitudinal G against speed is not useful in the top portion of the graph when it’s the same car with the same setup. All three drivers are accelerating at full throttle, and shifting appropriately, so the positive longitudinal Gs are the same. The bottom portion of the graph, which is braking G, shows noticeable differences between the drivers. The beginner brakes at a consistent negative G. The fast sim racer brakes lighter at lower speeds. I am braking a bit harder even at high speeds.
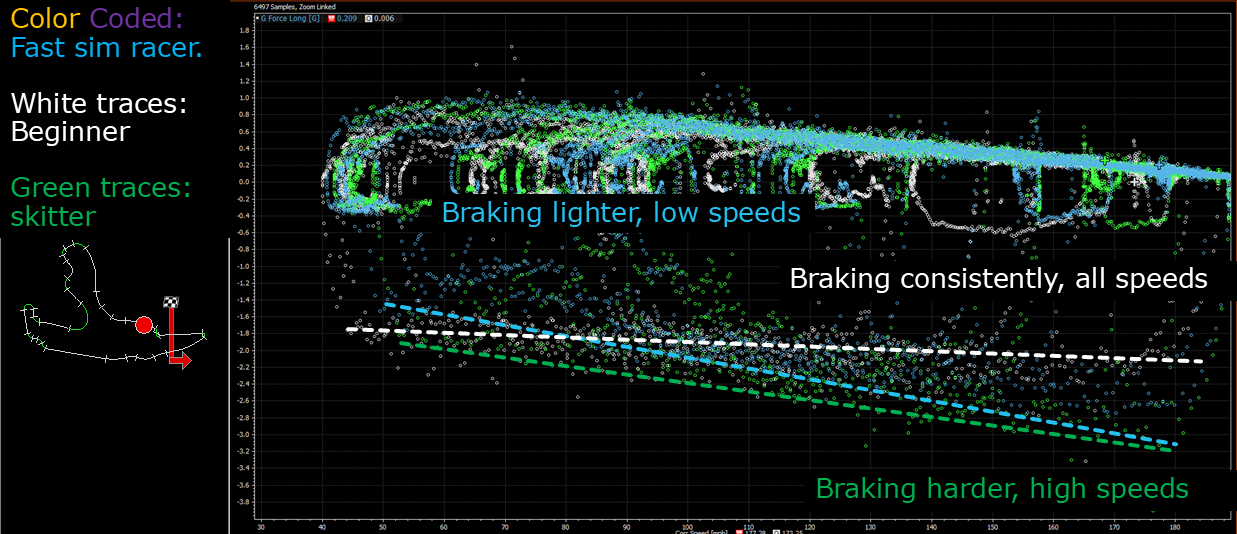
Fast driver braking lighter at low speeds. Beginner braking consistently at all speeds. I am braking harder, even at high speeds.
Plotting steering against speed makes it obvious I am using too much steering in the fastest corners. I am intuitively an ultra-low quality Alonso on Michelins. With great study and practice, I would like someday to be an ultra-low quality Alain Prost.
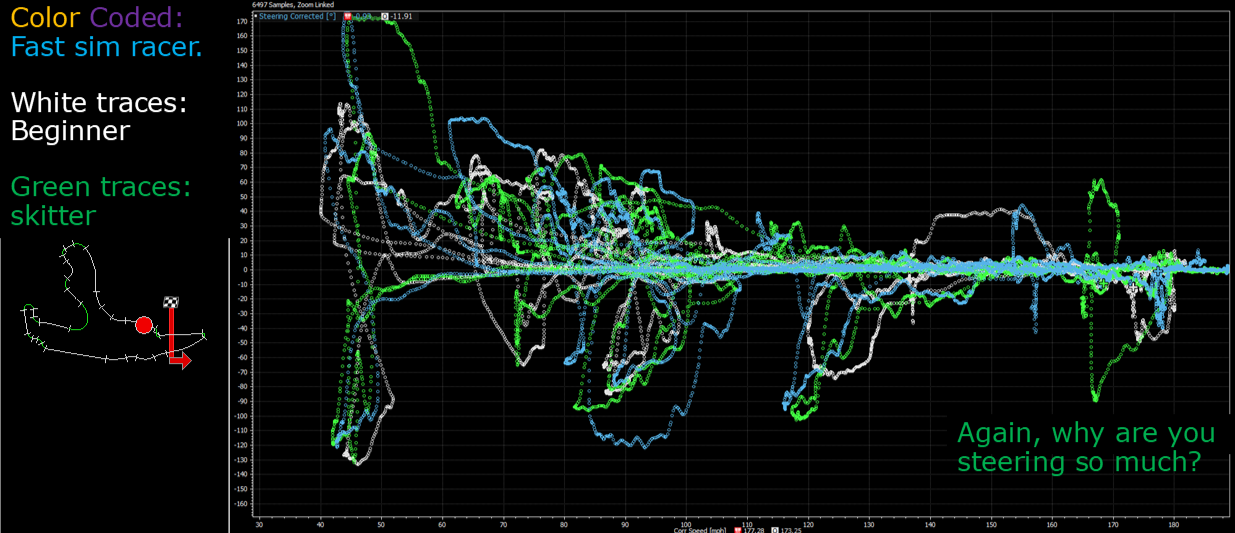
Again, why are you steering so much in a fast corner?
Everything shows in braking scatter plots
Getting to full throttle sooner on corner exit is the most important. Mid corner speed is the next priority. Fast corner entry is the last priority. Fast corner entry is also the hardest and highest risk to get right.
Plot steering and the rate of chassis Beta angle change against longitudinal G. Harder braking is to the left of each plot, harder acceleration to the right. There is the least activity around maximum braking, and the most activity around pure cornering at zero longitudinal G. My steering is nice and smooth turning right on the brakes, but super jerky to the left. And at the same level of deceleration, you can see the car snapping left into a slide as a result.
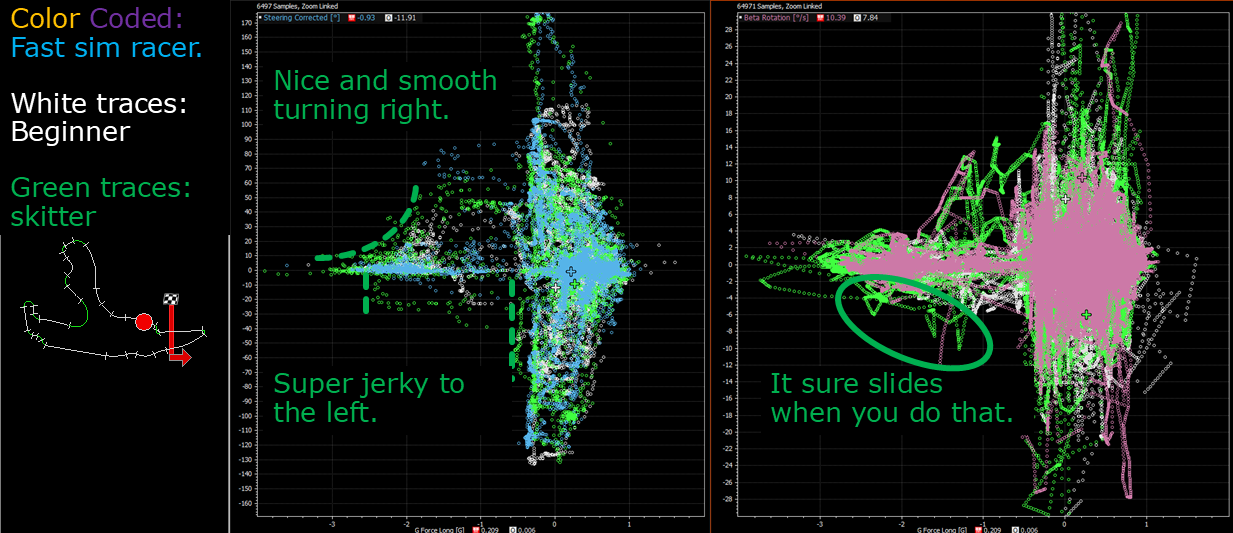
Nice and smooth turning right. Super jerky to the left. It sure slides when you do that.
The beginner driver is reducing braking more before turning left sharply. My older data looked like this. And on exit I am tossing the car to the left, but apparently I can't slide to the right?
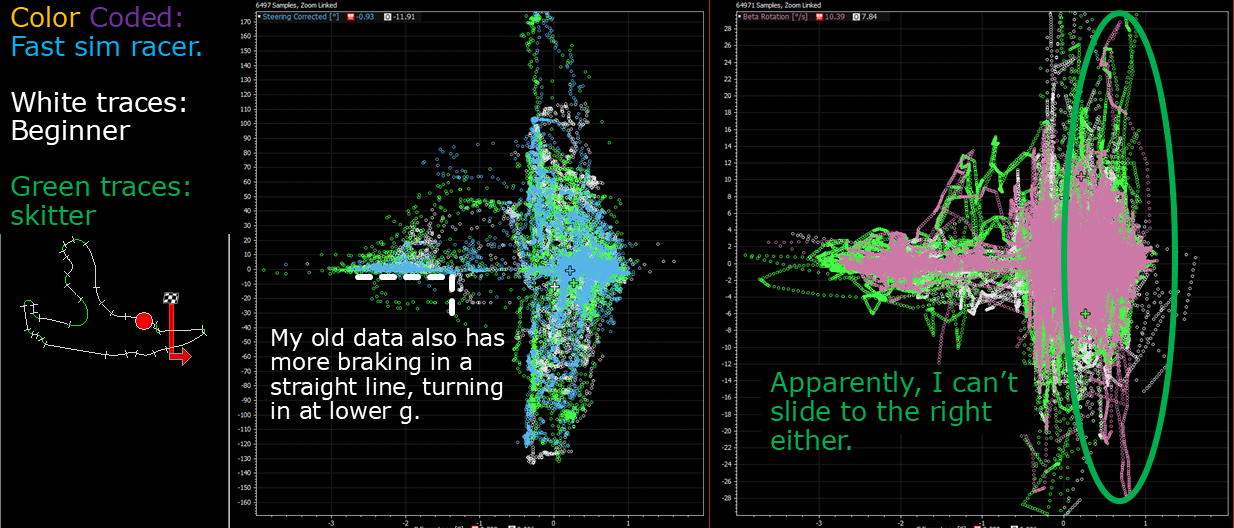
My old data also has more braking in a straight line, turning in at lower G. Apparently I can’t slide to the right either.
Changing to a plots of oversteer against longitudinal G, positive numbers are degrees of oversteer, negative numbers are degrees of understeer. Yaw rate derivative twitchiness is directional, so it’s unsurprising that it’s symmetric. My driving has some entry oversteer, the highest midcorner oversteer, and all of us have exit oversteer, naturally. The vast majority of the time, as always, the car is understeering.
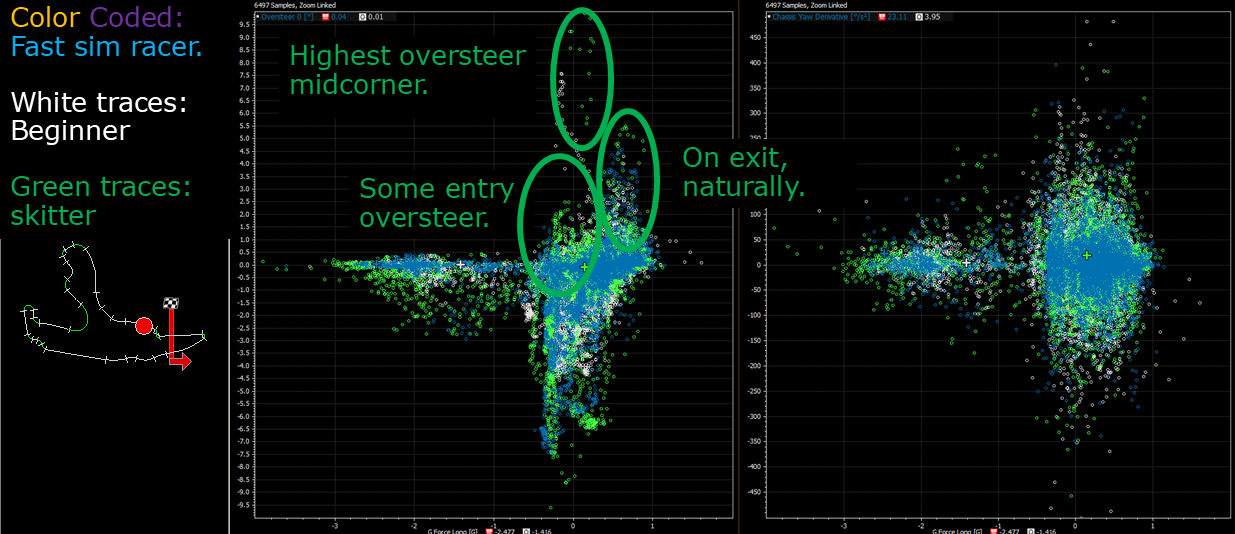
Highest oversteer midcorner. Some entry oversteer. On exit, naturally.
The next graph switches back to track distance. Speed, throttle, brake, steering, oversteer, and chassis Beta angle are graphed. More steering generally goes with more understeer (negative oversteer). You can see at Blanchimont where I overused the front tires so much the chassis barely took on a slide, underusing the rear tires and making the car slow through the corner.
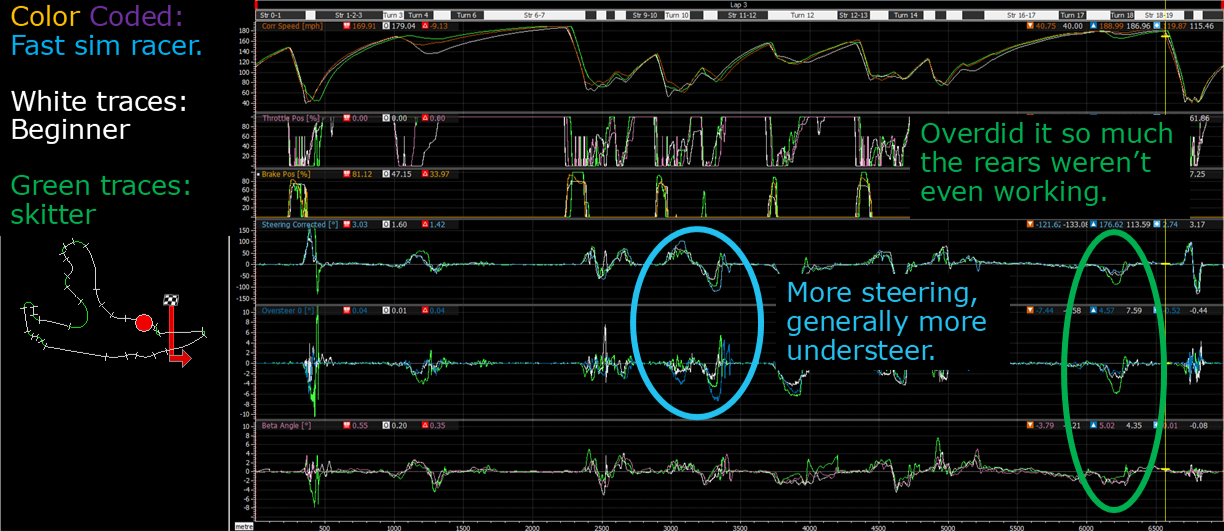
More steering, generally more understeer. Overdid it so much the rears weren’t even working.
Per Milliken, understeer is when the front tires have a higher slip angle than the rear tires. The only time the car is oversteering is when the rear slip angle is higher than the front slip angle. Oversteer is rare and brief. Note whenever the rear slip angle is higher, you are quickly applying countersteer. So even without a working oversteer calculation, countersteer is how you can identify the instances of oversteer.
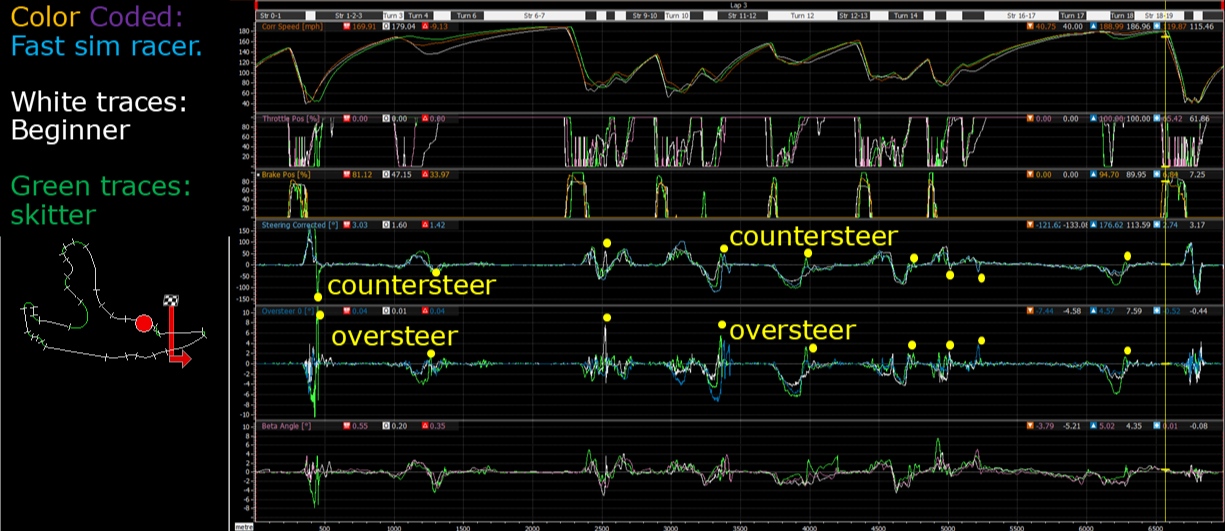
countersteer, oversteer, countersteer, oversteer
Plot the oversteer calculation against speed on the horizontal axis. Especially in an aero car, the weighting toward understeer should increase with speed. If oversteer increases with speed, the car becomes more undrivable the faster it goes. Like steering angle, I expect degrees of understeer and oversteer to generally (but not exclusively) get lower at higher speeds.
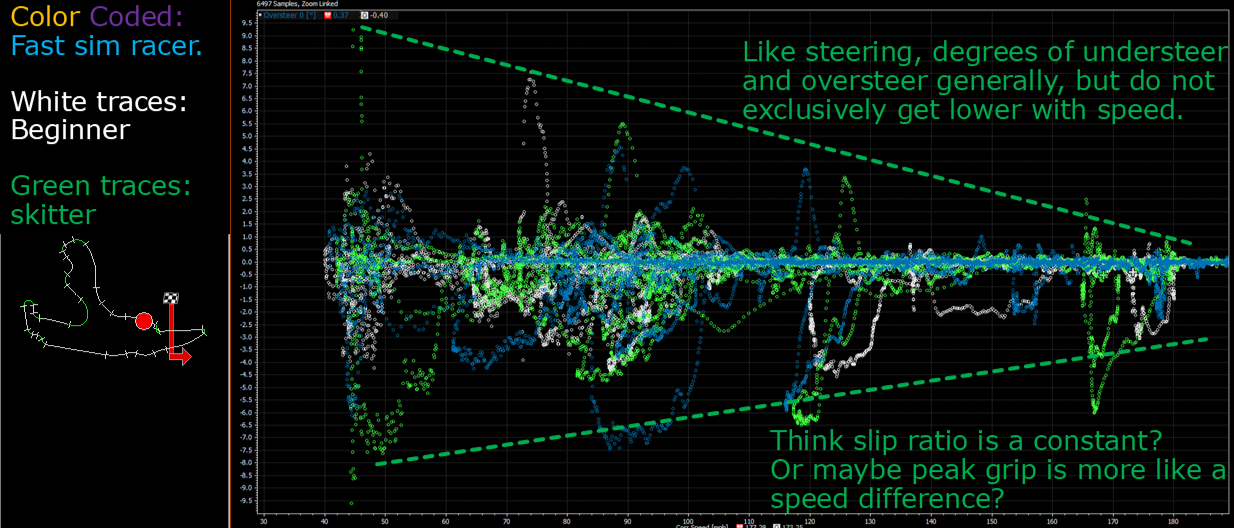
Think slip ratio % is a constant? Or maybe peak grip is more like a speed difference?
Do you think slip ratio is a constant percentage? 10% for ideal grip. That's what the internet says. So... braking from 300km/h, the wheels should be at 270km/h for maximum grip? Have fun crashing instantly. Good braking and acceleration come from single digit km/h differences between tire speed and vehicle speed. Whether accelerating, braking, or as a result of slip angle, I think the speed a tire is slipping across a surface is a much better target to hold constant than slip ratio percentage.
Data Detective Work
I use Riverside Short for all my car testing. In the fastest cars, it's a one minute lap. There are true high speed corners, both brief and sustained to assess downforce cars. There are fast left-right transitions. There is a merciless change of direction while braking. There is an uphill braking zone that changes to downhill, right at turn-in. There are long straights to place cars in the correct performance bucket. And there are steady state hairpins to reveal the basic mechanical balance.
This is a case of two competitor cars lapping within tenths of a second of each other. There is no need to even use pseudonyms for any particular game studio, mod creator, vehicle, or tire manufacturer these imaginary models allegedly bear any resemblance to.
Subjective feedback, car 1:
It encourages me to keep lapping.
And pushing faster every single lap.
Steering, drivability on the brakes, and exit throttle are all telepathic.
Subjective feedback, car 2:
I can’t feel anything through the steering.
It is threatening to lose the rear at any moment.
No idea where the limit will be, terrifying.
Can data show Traits that earn these cars get such different comments?
How is it possible for a car that is a remarkably bad fit for me as a driver to do the same laptime as a car that is a remarkably good fit for me as a driver? First of all, I would not have the same consistency in a car without good steering feedback. Second, grip limits are also perceived by overshoot or undershoot of the intended path, combined with the overshoot or undershoot of the intended rotation rate. And maybe the sound of squealing tires. These cues are the only feedback when driving on a controller or keyboard. Regardless of the quality of steering feedback:
Unwanted and unpredictable oversteer is what makes a car undrivable.
Understeer is always drivable, you just have to slow down.
Intrinsic balance between mass, tires, and aero is what makes a car fast. Suspension tuning can only use load transfer to alter traction and change the balance. Torque vectoring typically consumes traction to change balance. Understeer tuning applied to an intrinsically oversteering car can still snap. I generally find that unpleasant to drive. Oversteer tuning applied to an intrinsically understeering car probably means it gets more unstable the faster it goes. The worst of both worlds.
Can you spot the difference between the two cars in yaw derivative twitchiness, rate of chassis Beta angle change, or steering speed? In this section, the color coded traces are from the car I drove with fear and loathing, and the white traces are from the car that made me want a tattoo surrounded by hearts. I don't see any crazy outliers. If pressed I could say there is more constant low-level yaw derivative twitchiness, but the numbers aren’t big. The rate of change in chassis beta angle isn’t too different. Maybe I’m constantly managing with busier steering inputs.
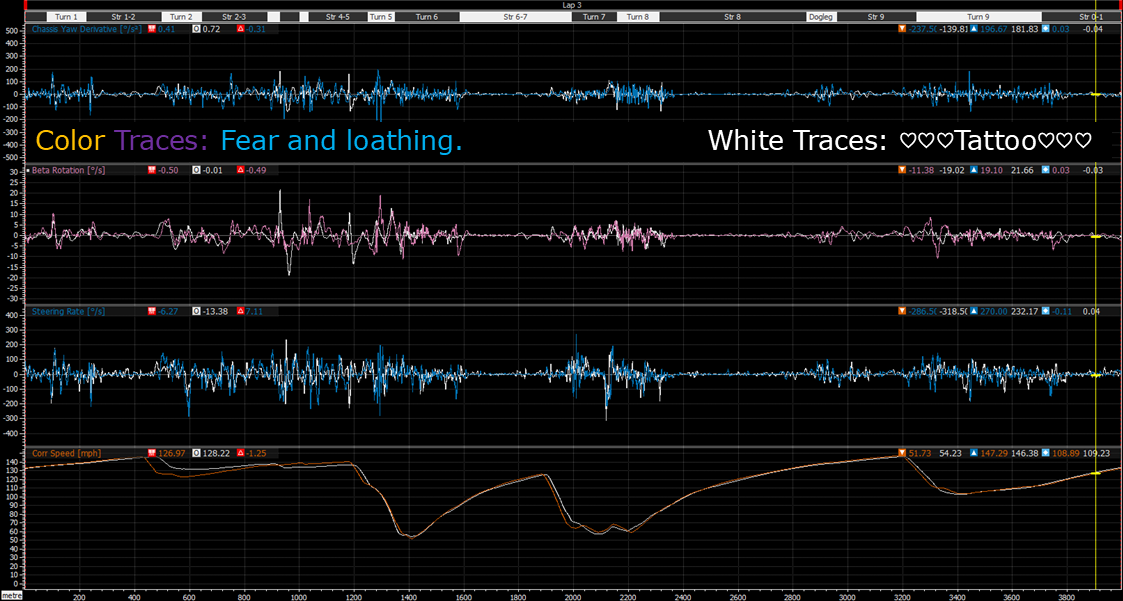
Color traces: Fear and loathing. White traces: Heart tattoo.
Is there a difference in total grip? The track map shows the speed differential, most noticeable in the fast Riverside Turn 2, and the entry to the hairpin. The difference in the steering peaks are because I'm taking the corner so much slower. Lateral G vs. speed is the same for both cars, as it should be in the same class. So it's not an absolute lack of grip.
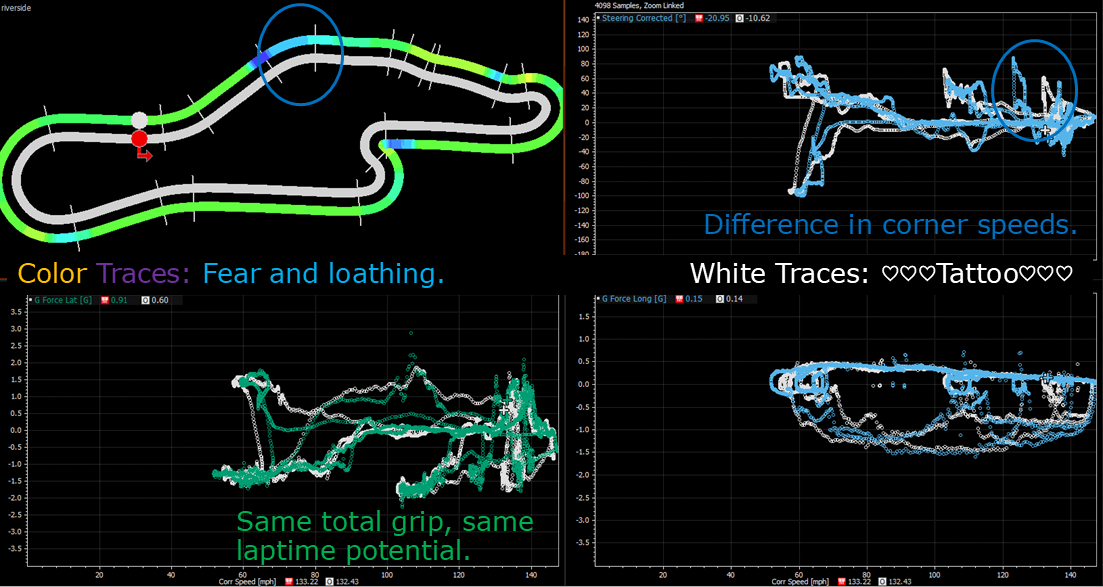
Difference in steering peaks is from difference in corner speeds. Same total grip, same laptime potential.
Is it visible in the throttle, brake, or steering traces? I'm braking the Jinba ittai car later, as you should. That tells me nothing about why. Steering looks about the same.
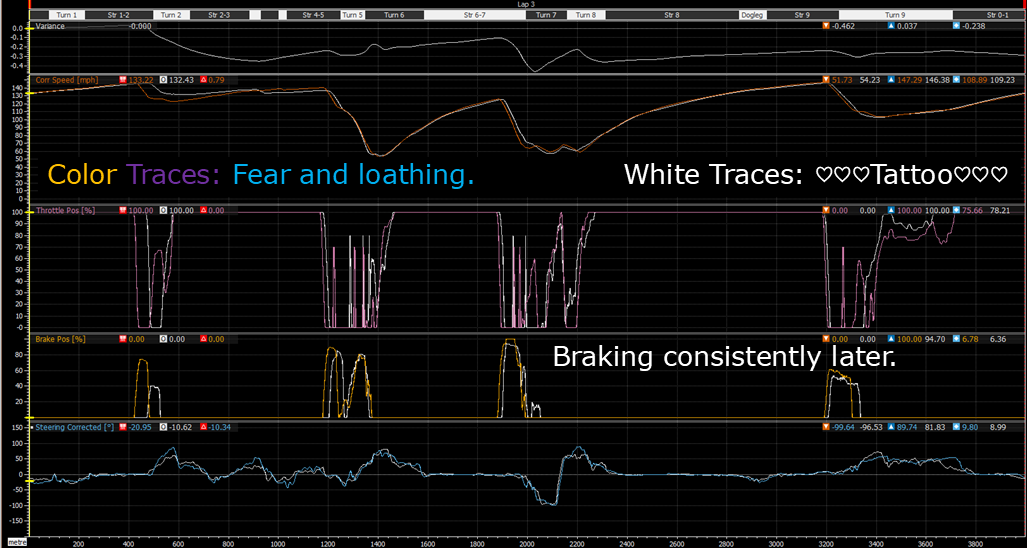
Braking consistently later.
Switch to track map for a better visualization of differences in braking, plus an overlay of yaw derivative twitchiness (pink), plus throttle divided by gear (blue). The outside track is the sweetheart, and it is clear that I am braking later and trailing deeper (shades of red).
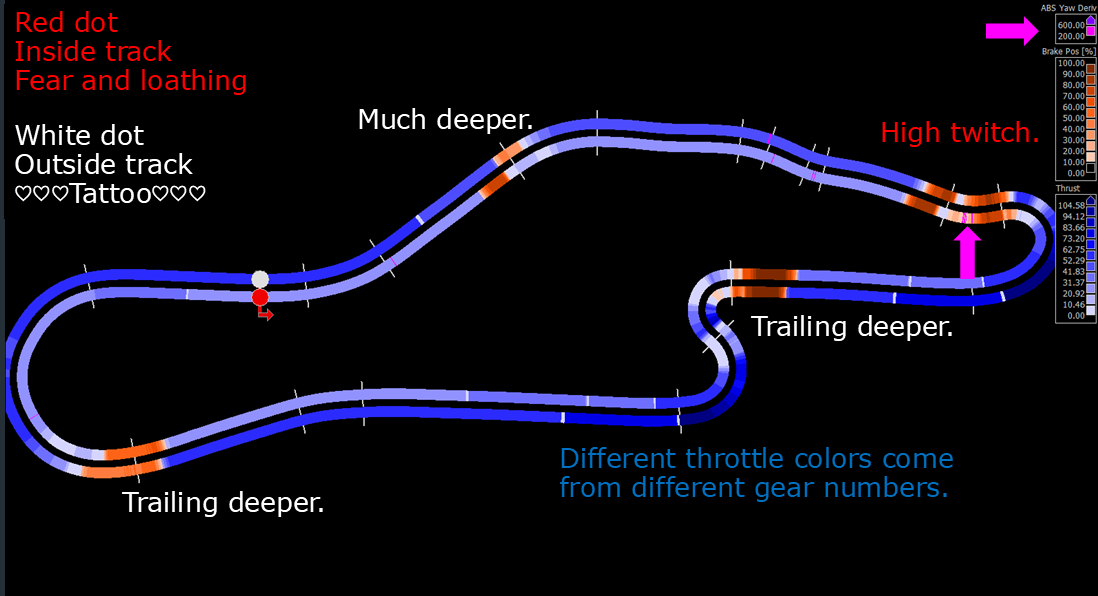
Different throttle colors come from different gear numbers. Trailing brake deeper, much deeper. High twitch spikes shown for scary car.
I like to do another version of the track map where I sum throttle divided by gear, brake, and steering wheel angle up into a meaningless total number that represents how hard I am driving a car. Orange (>= 100%) shows where I am using significant steering and throttle or brake. This is also useful for finding unintentional throttle / brake overlap. (Right foot braking is obsolete.) Blue (0%) shows gearshifts. Blue also shows up after braking in the scary car, where I let all the controls briefly go to zero before turning in. No brake, no throttle, no steering, trying to settle and not upset the car before going through a turn. But this is still only a symptom, not a cause.
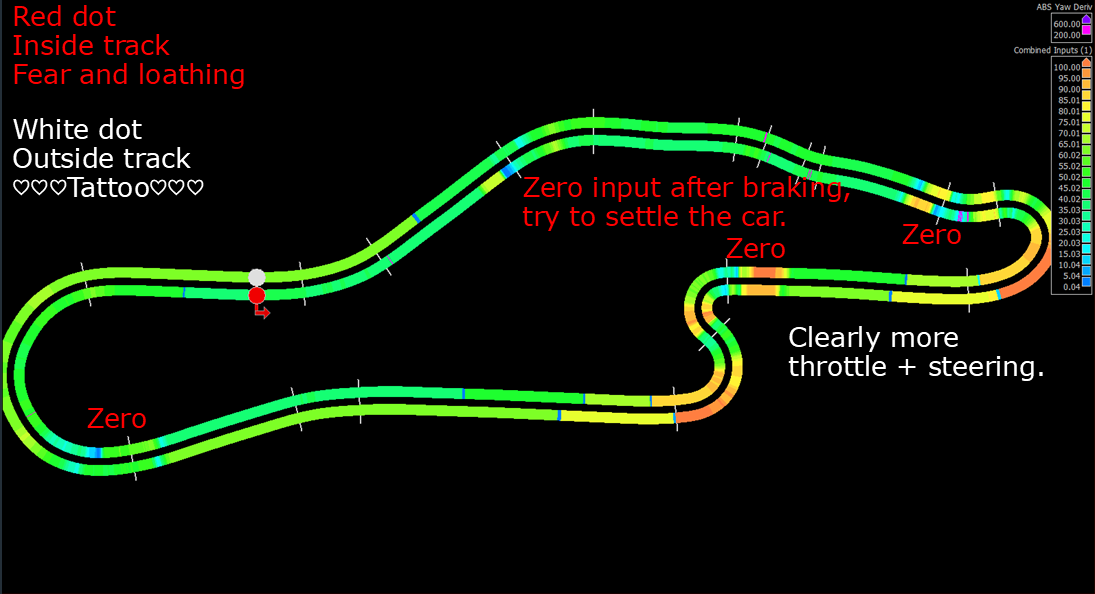
Zero input after braking, trying to settle the scary car. Clearly more throttle and steering for the ultimate driving machine.
Another way to show zeroes is combined (pythagorean) G. When I am scared in Turn 2, there is a big gap between braking G and turning G (blue). When I am comfortable turning on the brakes, the white combined G trace doesn't drop as I transition from braking, to turning, back to braking, back to turning.
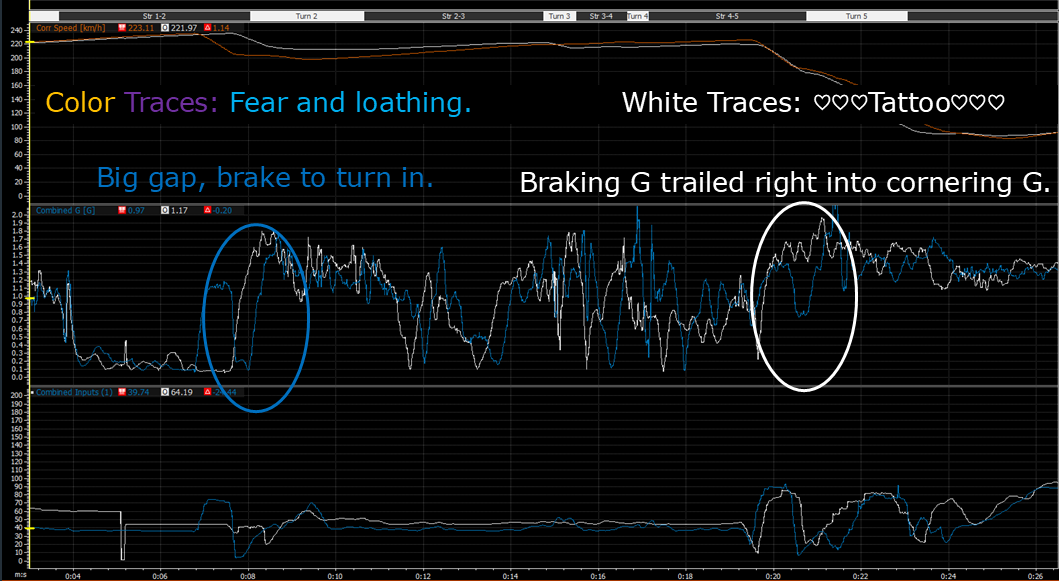
Scary car: Big gap, brake to turn in. The other, braking G trailed right into cornering G, accept no substitutes.
Can I spot a scary car versus a car that's easy to drive in Oversteer, chassis Beta angle, or twitchiness? In Beta, the easy car just holds an angle through a speed change on the brakes. The scary car is a little spiky. There's a little more nervous oversteer. Maybe a little more twitchiness.
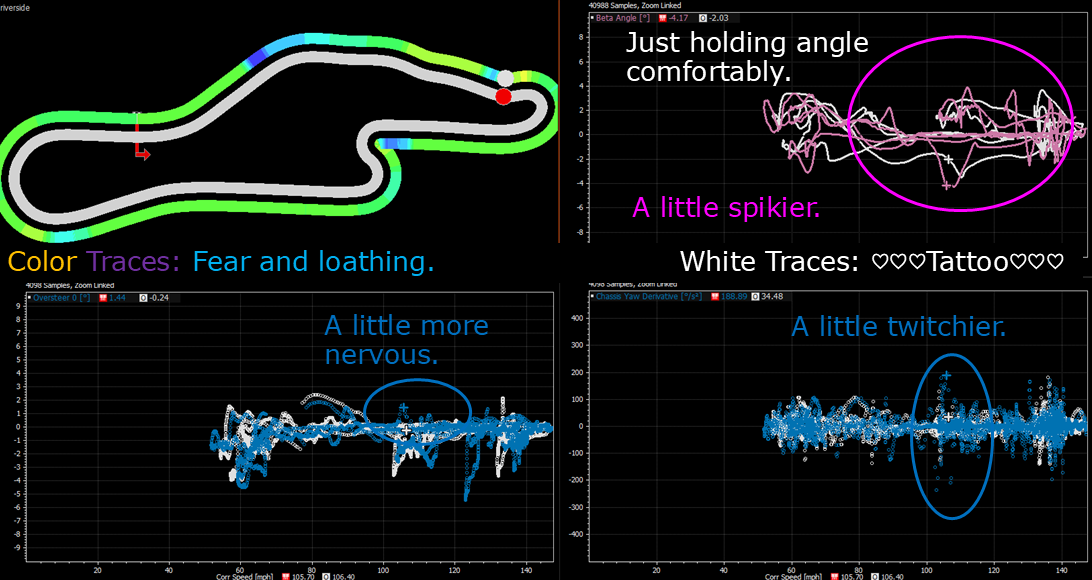
Just comfortably holding angle, vs a little more nervous, a little twitchier.
Let's find the location of those little nervous spikes using the track map, then find them on the oversteer graph. Braking into a very fast corner, the car is oversteering when I am lining up the entry, before even seriously turning in. No wonder I'm white knuckle wide eyed hanging on for dear life.
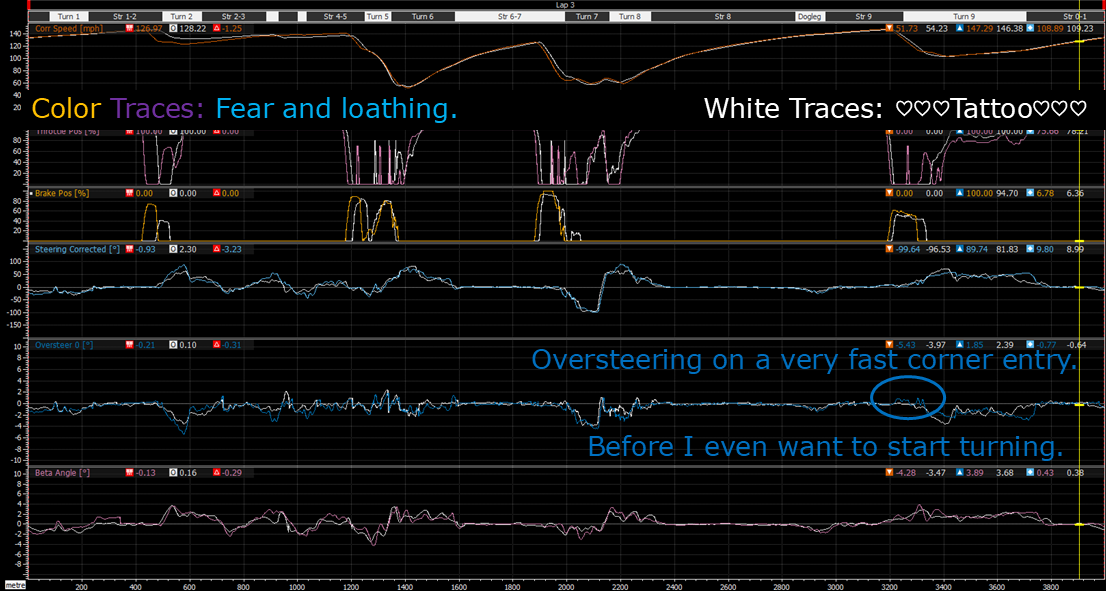
Oversteering on a very fast corner entry, before I even want to start turning.
Switching to a graph of combined G, you can see stair steps in the blue graph entering the corner. Subconsciously, I am taking little bites with the steering, and even pulling back after each, because I don't know when it is going to bite me back.
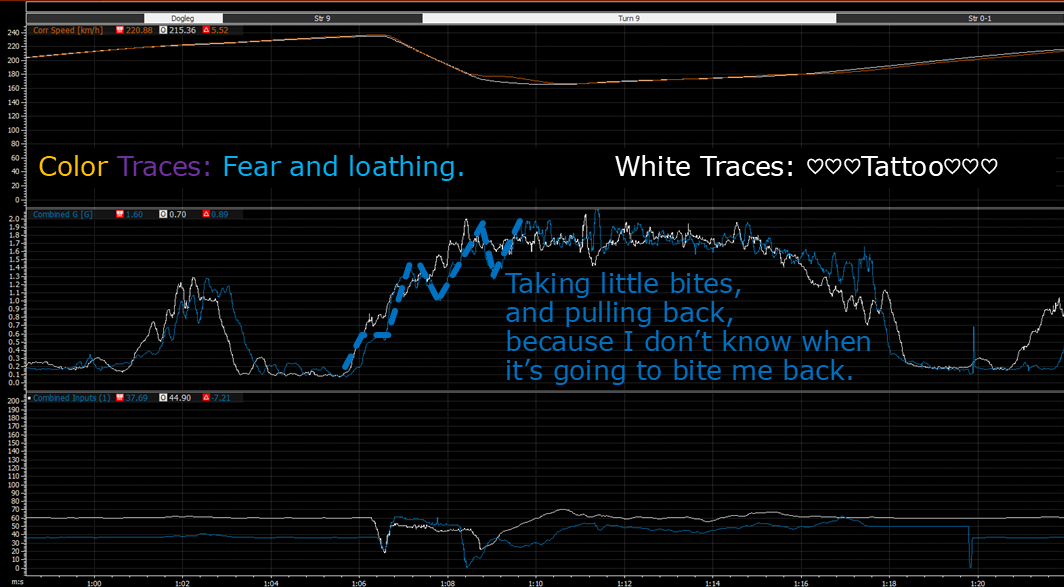
Taking little bites, and pulling back, because I don’t know when it’s going to bite me back.
Basic and obvious tuning to reduce entry oversteer:
Adjust the brake bias forward.
Can rear toe-in be increased?
Can the front roll stiffness be increased?
In braking, the tuning power of the front is greater than the rear, and vice versa.
Can rear downforce be increased?
Will be less effective at low speeds.
But all this still doesn't explain why the cars are so different. These steps could be taken with no analysis, based only making the rear less nervous. It is interesting how a very unpleasant car mostly looks fine on paper. The car is fast, competitive. Subjective comments are important, but they are not good indicators of whether a car is faster or slower.
Sim racers underrate the strategy of picking the most enjoyable car to drive. But what do you do if you're stuck with a nightmare car? Sims make it very convenient to look directly at tire loading. But that still comes from simulated load transfer and suspension characteristics. Are there any differences in suspension movement? It's wonderful always having this in the sim data. In this case, oversteer, fear, and loathing come from a car with more front droop, especially the inside front. And more rear bump, with flatter rear roll.
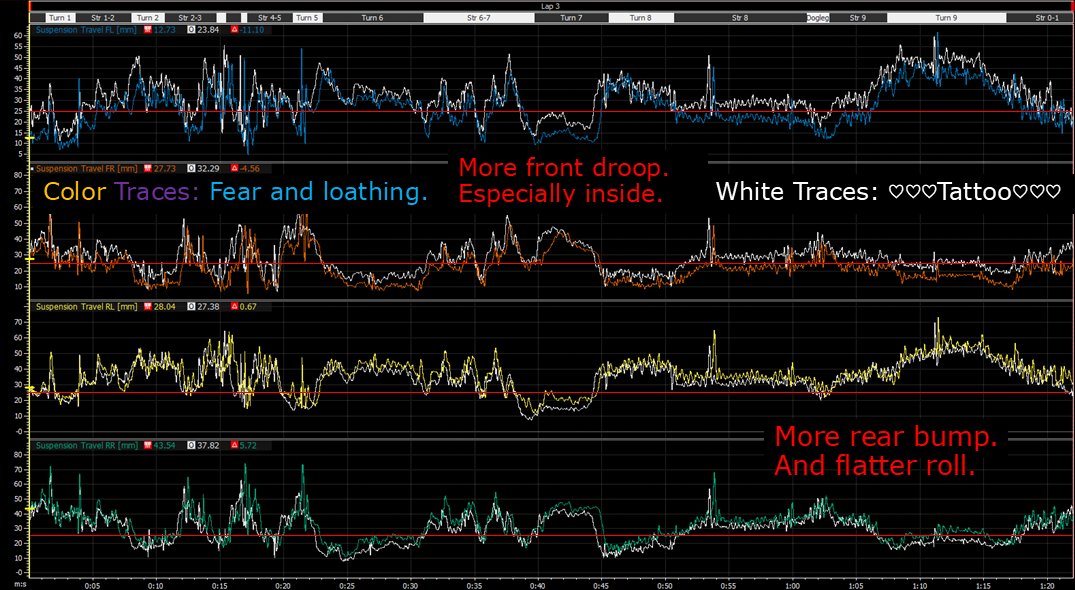
More front droop, especially inside. More rear bump, and flatter roll.
Plotting suspension travel against speed, in the car that’s scaring me, the nose is lifting at high speed. Is this contributing to the fact that I have nothing nice to say about the way it drives?
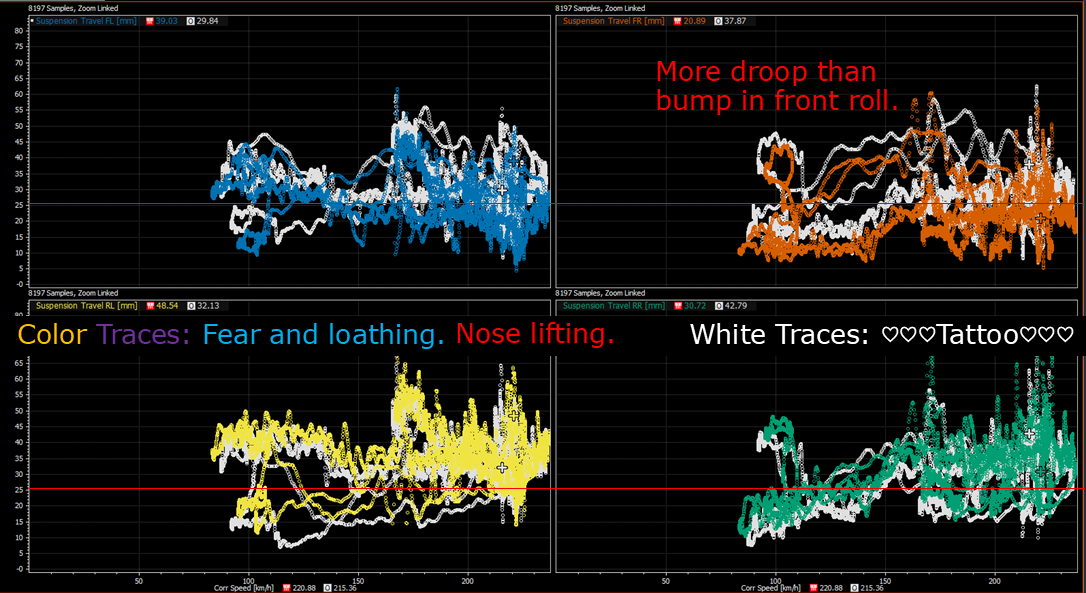
More droop than bump in front roll. Nose lifting.
What are experiments to bring the nose down or reduce the inside front droop?
Softer front spring rate?
Would increase the rear roll stiffness %, oversteer says no.
More front downforce or less rear downforce?
More high speed front grip, oversteer says no.
Lower front ride height, higher rear ride height?
Good chance that higher rear roll center + oversteer says no.
Stiffer front roll?
Higher front roll stiffness %.
Flatter.
But will this unload the inside front even more?
More front rebound?
Slower lift, slower roll.
Higher front roll % in transients.
I'm open to other theories.