Overall Vehicle Priorities
All of your design decisions need to weigh their legality, effects on reliability, overall performance, and the drivability of your vehicle. This process separates the top teams on the track and design from the rest, and it is used throughout the design process while: setting requirements, allocating time and resources, and choosing between designs.
There are many important parameters to describe your vehicle’s ability, but I am going to select 10 that should always be considered. I will group them into three categories:
parameters that contribute to finishing the events (passing the technical inspection and reliability)
vehicle performance (tire coefficient of friction (μ), mass, power, lift, and drag)
and those that allow your driver to extract all the potential performance of your vehicle (controls & ergonomics, balance, and control & stability).
For each parameter I will describe why they are important, what affects their value, and a few strategies to improve them. There are many other important parameters—namely CG height, moment of inertia, rotational inertia, fuel consumption, top speed, to name a few—and I expect others have different priorities and categorizations than the ones I present.
These parameters are used to set overall vehicle priorities and measurable overall vehicle requirements. Measurable sub-system requirements are then generated to support your overall vehicle priorities and requirements. Make every subsequent design and resource decision while considering what best supports the overall vehicle and sub-system priorities. Doing this will allow your team to focus on what matters the most and take conscious steps to achieve your goals.
Finishing the race
Before considering the potential performance of your vehicle or your drivers’ ability to extract that performance, you will need to finish the events. To finish the events, you will need to pass the technical inspection and your car will need to withstand the abuse of the competition. The only thing worse than getting black flagged halfway through the endurance event is not turning your car on during the competition because you did not read the rules and check your car against them—I say this with experience in both.
1. Passing the technical inspection
1a. Start by reading all the rules and understanding each of the events. I know you hear this a lot! This is because after watching many teams and students not spend the time to really understand the rules, they end up not competing or spending 100x the time they saved not reading on redesigns and rebuilds. If you can, make it fun and hands on (inspect old cars, do a trivia event, jeopardy, you name it).
The rules determine what the competition is and provide some of the bounds for your design. You will want to know all the events that your vehicle competes in and design it for those events. I would recommend performing analysis, simulation, and testing on all the expected events of your competition, Figure 1.

Figure 1. Understanding, analyzing, simulating, and testing for the real competition is essential to doing well in the limited attempts you have at each event in the competition. If you have, you should be able to figure out what the shapes and colors represent in this figure.
1b. After getting an understanding of all the rules, revisit the rules related to your designs often. Summarize them and explain them to other team members and subsections. Figure 2 is an example combining relevant material to help with inspection of the chassis and explaining rules to other members of the team.
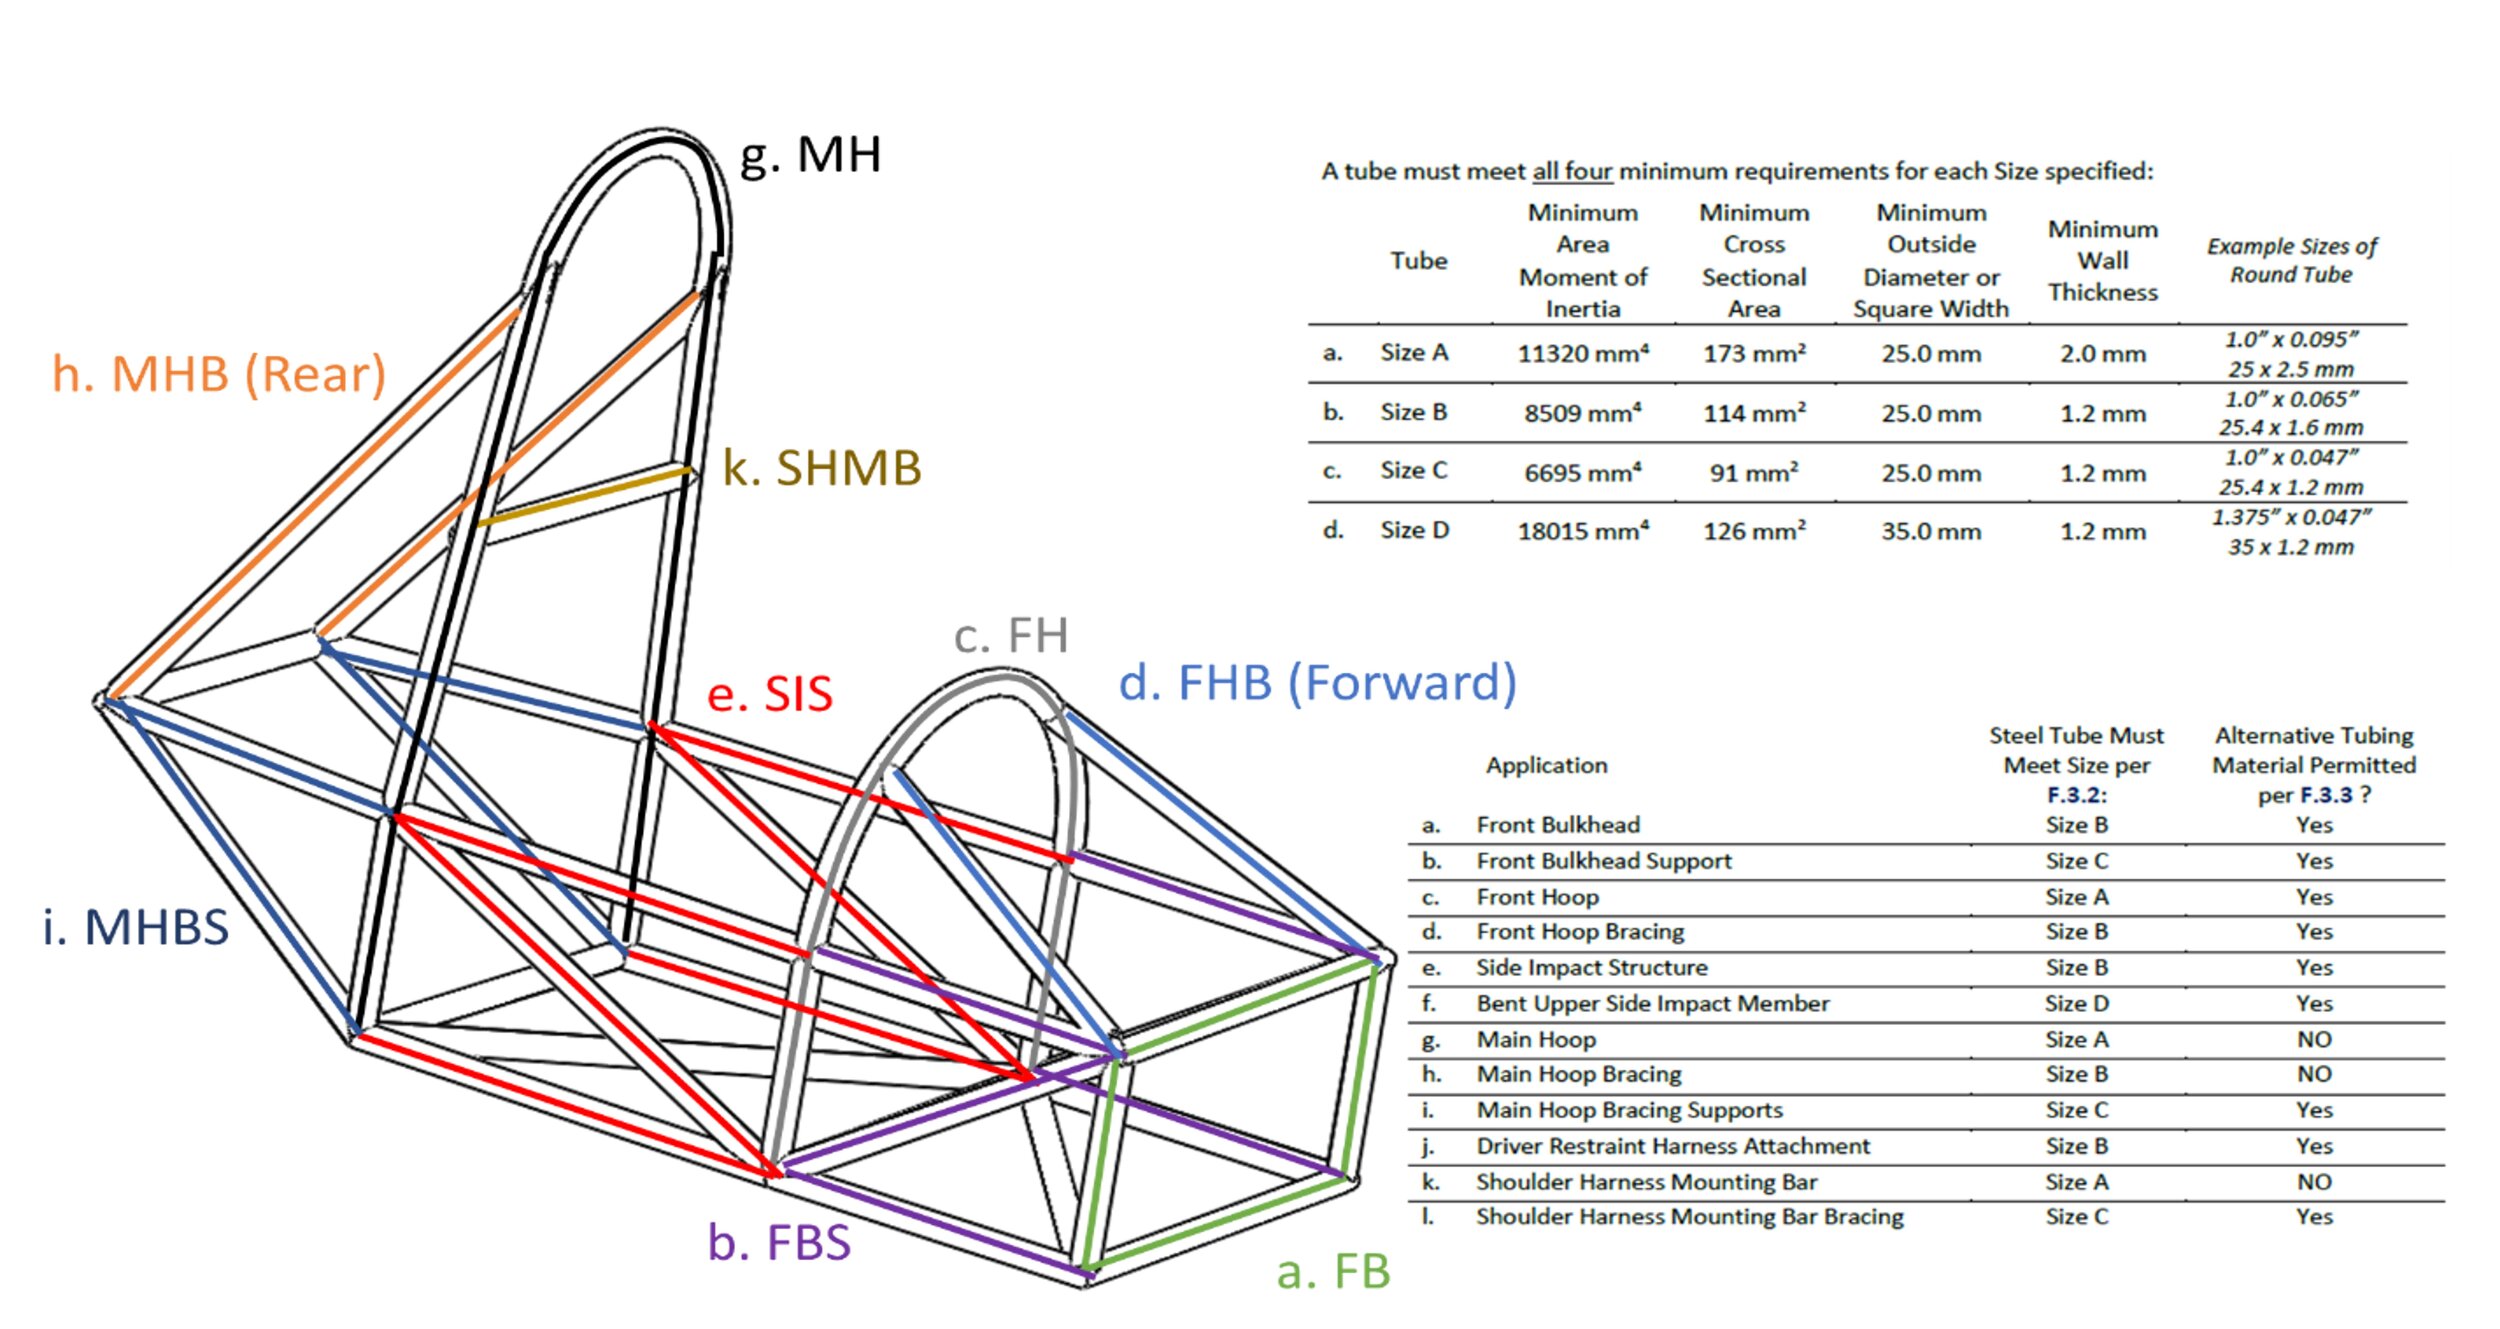
Figure 2. Frame (AKA chassis) tube names and size requirements from the 2021 FSAE rules as an example. Warning! The rules might have changed since this was posted, so see this as an example and not as a definition of the rules. Sometimes making your own diagrams, such as this can help you understand and check your designs.
1c. Have alumni or other competition teams inspect your design and build. Someone who is not invested in seeing your car pass the technical inspection will do a better job at finding the areas where you are deficient.
1d. Perform egress, noise, brake, and tilt tests before competition. Make sure your instruments are accurate; my teams have missed the dynamic events because they did not check/calibrate their sound instrumentation.
1e. Be ready to roll your car into technical inspection the night before. Too often a couple of bolts left untightened and a few skipped zip ties can turn into a multi-hour job and lead to missing dynamic events.
1f. Have a plan for who will be in the technical inspection with a few common tools, tape, and zip ties; who is ready with immediate tools and supplies; who is a runner for parts from the trailer or truck; and who can ask other teams for parts when needed. Be prepared for anything; triage when multiple things go wrong simultaneously.
1g. Passing the technical inspection early will set you up for success in the dynamic events.
2. Reliability
2a. Remember that everything that can go wrong, will go wrong at competition. You need extensive preparation to be ready for all the potential failures. If your goal is to finish endurance, I cannot stress how important it is to repeatedly test in a simulated competition environment.
2b. Choose your factors of safety with care. How important is the mass of your vehicle relative to your reliability for your team’s objectives? Avoid putting material in bending. See the article on Design of Strong, Stiff, and Light Structures and Joints on this site for more details.
2c. Do things right the first time—it will take less time in the end. Check everything in CAD during design, then test and check everything again during assembly.
2d. When you have a failure or issue with your design, do not assume it was a one in a million defect in the part or assembly. There is always a cause and it is going to repeat itself, Figure 3. Check everything again in CAD, and hand/bench test parts and assemblies, and go through data and calculations until you figure it out.
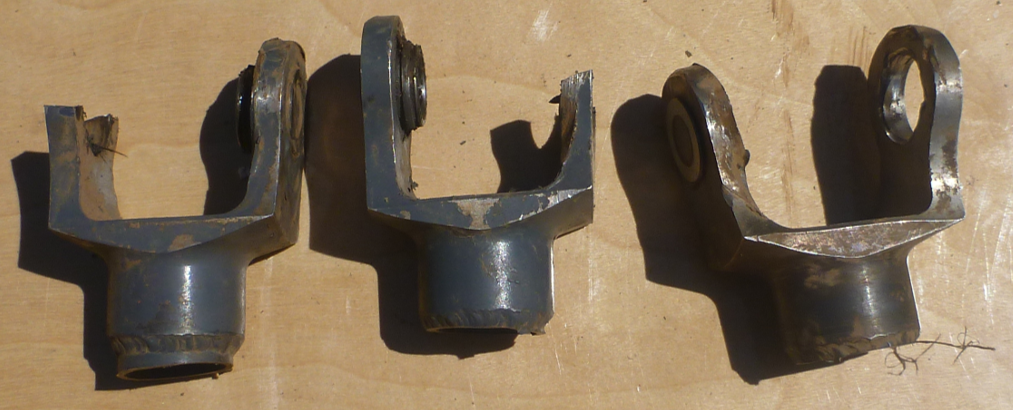
Figure 3. Above are only a few of the broken yokes from an SAE team during one competition. The initial issue presented itself during testing, but the team believed it was due to a bolt not having adequate positive locking. The assembly was put back together with slightly more care, but the uprights failed during early events in the competition. As a result, the team gusseted the uprights to increase their strength. Then the yokes started breaking. The root cause was too high of an operating angle for the yokes resulting in interference as they rotated. Travel limiting straps immediately fixed the problem, but we didn't figure that out until after breaking again in endurance. This is an example where a failure in one component can result from a poor design of a different component and how an inability to properly investigate the root cause—the first time—resulted in a much larger loss in time and performance in the competition.
Vehicle performance
Understanding the effects of tire coefficient of friction (μ), mass, power, lift, and drag on your vehicle’s performance in the events is a powerful tool to help set the team’s objectives to make overall vehicle design decisions:
What engine do you use?
What vehicle footprint (front and rear track width and wheelbase) do you choose?
Do you use downforce generating aerodynamic elements on the vehicle?
Do you use larger tires with more grip or smaller tires with less grip?
This parameterized approach was nicely presented by Peter Wright in Formula 1 Technology and Ferrari Formula 1, which are both very interesting reads.
In this section I will present the influence of each parameter on a point mass simulation of a specific single-cylinder FSAE vehicle on the Michigan 2014 endurance track. Keep in mind that these values depend on your own vehicle and which track you will be “navigating” in your simulation. As you will see in this section, the point mass simulation is not a great tool for understanding the effects of mass on your vehicle performance or for deciding on the footprint of your vehicle.
With those caveats, I am providing them to show an order of magnitude effect of each parameter and the power of considering them, in the hope you will consider evaluating the effect of overall vehicle parameters on your car’s performance with a similar tool, more advanced tools, and testing when making overall vehicle decisions.
Once you calculate the effect of each parameter, you can evaluate and trade various overall vehicle priorities and designs to identify which of them best helps your team reach your objectives.
3. Tire coefficient of friction (mu)
In my point mass simulation of a specific non-aero single-cylinder vehicle on the FSAE Michigan 2014 endurance circuit: 1% increase in lateral and longitudinal tire μ results in 0.35% and 0.05% reduction in lap times, respectively.
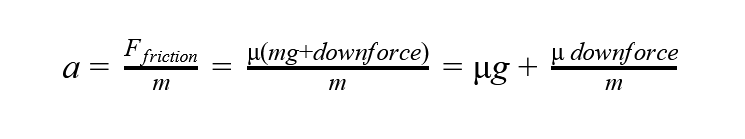
3a. All the forces that contribute to accelerating your vehicle longitudinally and laterally result from the friction between your tires and road surface. It is no coincidence that your ability to generate friction with the road surface is of critical importance to your lap times. Grip is the general term used to describe the maximum friction forces that can be attained by your tires. The maximum friction force from each tire is the product of normal force and tire μ (more precisely called normalized lateral/longitudinal forces for a rolling object). The maximum acceleration of your vehicle will never exceed the friction you generate divided by the mass of your vehicle.
If you have an average coefficient of friction of 1.6:
At low speeds you can only accelerate laterally and brake at 1.6g and max acceleration will increase with downforce, equation below.
With rear-wheel drive, you can accelerate forward at the product of 1.6g and the percentage of the total vehicle load on the rear axle.
To visualize grip, draw a performance envelope for longitudinal acceleration and lateral acceleration as a function of speed (often called GGV plots); note this envelope also depicts effects from your powertrain, aerodynamics, suspension setup, etc.—but that only makes it a more powerful tool for a vehicle designer. The larger this envelope is, the faster you can go in slow sections (turns) and the more you can accelerate between slow sections and fast sections of the course, resulting in longer periods of time spent at high speed—both resulting in higher average speeds and reduced lap times.
Figure 4 provides an example performance envelope showing acceleration as a function of speed with an example of how your driver and vehicle will navigate around the envelope during a right-hand turn.

Figure 4. Lateral and longitudinal acceleration versus speed and the progression around the performance envelope.
(1 to 2) full throttle acceleration from a standstill to top speed and arriving at the braking point
(2 to 2’) instantaneous full throttle to maximum braking without changing speed
(2 to 3) decelerating, blended braking and turning in until reaching the minimum speed apex
(3 to 4) blended cornering and acceleration out of the corner until reaching the straight
(4 to 5) accelerating to top speed (between 4 and 5 it overlaps with the previous line, but I separated them for clarity).
At low speeds, this grip ellipse in the acceleration plane is governed by the grip of your tires. At high speeds this envelope can begin to grow if you have aerodynamic elements that can generate downforce. The slope at the front of the graph begins at the transition from traction limited acceleration to propulsion limited acceleration and is a function of engine, power, drag coefficient, and rolling resistance.
3b. The largest contributor to your envelope will typically be your tire selection and the control of the tire’s angles relative to the ground, temperatures, pressures, wear, etc.
3c. Tire μ goes down as normal load increases, Figure 5. Therefore, reducing load transfer and keeping all four tires more evenly loaded results in higher average grip. Load transfer happens because the force accelerating your vehicle is applied on the bottom of the tires and the CG of your vehicle is above that, resulting in a moment about the CG to be balanced with non-equal normal forces. To increase grip, reduce the load transfer while accelerating (lower CG and larger vehicle footprint) and reduce the load oscillations on the contact patch (this is the purpose of dampers).
3d. One scenario where weight transfer is useful is while accelerating forward in a rear-wheel drive vehicle as it will result in rearward weight transfer and improve the overall force of traction you can generate. I would not recommend increasing the CG height or decreasing the vehicle wheelbase for this purpose.

Figure 5. Left) Maximum tire μ as a function of downforce (black line, left axis). Right) Slip angle at the maximum tire μ as a function of downforce (blue line, right axis). The max tire μ decreases with downforce and is the reason for reducing load transfer. The decreased grip is for a 400 lbf vehicle going from having forces evenly distributed on four wheels to having all the weight on two wheels as would happen in a very hard turn. Credit to the Formula SAE Tire Test Consortium (FSAE TTC) and the Calspan Tire Research Facility (TIRF) for the data in this figure.
Keep in mind the values from these tests over predict the grip by as much as 50% due to the differences in the test surface and the actual Formula SAE road surface.
4. Mass
In my point mass simulation of a specific single-cylinder vehicle on the FSAE Michigan 2014 endurance circuit: 1% increase in mass results in a 0.1% increase in lap time from a point mass simulation. Take that with a grain of salt. A point mass has no load transfer, a higher simulated mass does not appropriately reduce tire μ during moments of acceleration like cornering, acceleration, and braking.
4a. Track the mass of each component and subsection of your vehicle and compare your expected mass to the measured values to identify areas where the most improvement can be made.
4b. The location of your center of mass is also very important. Lower the better; again, reduce the load transfer.
4c. Consider the other sources of inertia in the system; namely, rotational inertia in the tires, wheels, hubs, and drivetrain and the moment inertia of your vehicle.
4d. Use material loaded in tension, compression, and shear to minimize the mass of your vehicle; do this by using tetrahedra and triangles in your design. You will also want to spread forces over a large distance in the chassis and hold moments with links perpendicular to moment arms to minimize stress and compliance of your parts.
4e. Mass is frequently a tradeoff with reliability; see 2b for more details. Figure 6 is an example of what can happen when you too heavily prioritize mass.
4f. Reducing the mass of your vehicle will also reduce the loads on the vehicle一allowing further reduction in the mass of the components and vehicle.

Figure 6. I applaud students trying new things—when you are in school is a good time to do it. Our Baja team decided to add some holes to lighten their A-arms between two competitions and it resulted in a failure of the part. If our primary objective was to win the competition, this was probably not the wisest choice as there was little change in the total mass—especially after the holes filled with mud.
5. Power
In my point mass simulation of a specific non-aero single-cylinder vehicle on the FSAE Michigan 2014 endurance circuit: 1% increase in power results in a 0.05% decrease in lap time.
5a. Power will influence the longitudinal acceleration while you are propulsion limited (curved light blue line for the example car in Figure 7) and it will affect your top speed (red circle in Figure 7 showing the speed where the propulsion limited acceleration equals zero).
By creating a free-body diagram of the vehicle in the longitudinal direction—and knowing that the product of the tractive force and velocity of the vehicle is equal to the power delivered to the wheels—you can find the following relationship with terms, from left to right in the equation, representing
the power required for acceleration [mass (m), acceleration (a), and velocity (v)]
rolling resistance [coefficient of rolling resistance (μ_RR)
weight in normal direction to surface (Wcosθ) and velocity (v)
drag [density (ρ), frontal area (A_frontal) drag coefficient (C_d), and velocity (v)]
traveling on a non-horizontal surface [component of weight in the direction of motion (Wsinθ)]
This relationship can be used when measuring the previously stated parameters to simulate the acceleration event, find your top speed, and more.


Figure 7. Traction limited acceleration (dark blue, left axis), propulsion limited acceleration (light blue, left axis), power consumed by rolling resistance (black line, right axis), and drag (gray, right axis) as a function of velocity for a vehicle on the scale of a Formula SAE vehicle. The vehicle is limited by traction up to ~30 MPH, by propulsion above ~30 MPH, and with ~60 hp, reaches a top speed ~90 MPH (red circle). All of these depend on your vehicle parameters; do not assume these are right for you. Deviations from the propulsion limited acceleration will be present whenever the engine is not at an RPM corresponding to maximum power due to using a set of fixed gears between the engine and wheels.
5b. An analysis on the tradeoff between engine power, packaging, reliability, and mass一to name a few一 should be considered when choosing your engine.
5c. The maximum power for internal combustion engines is limited by the rate at which you can supply air in your engine through the intake restrictor. Optimizing the design of your plenum, runner, engine timing, and exhaust (to mention the factors that do not require significant engine modification) can be used to maximize this rate. See Restrictors And Plenums And Sometimes Turbos for more details.
6. Lift and 7. drag
In my point mass simulation of a specific single-cylinder vehicle with aero on the FSAE Michigan 2014 endurance circuit: 1% increase in lift and drag results in a 0.07% and 0.03% increase in lap time.
6/7a. The decision to add aerodynamic elements to your vehicle for the purpose of generating downforce is one of the hotter topics in Formula SAE. See Adding Aero, Justifying Aero for a great discussion of that. Reiterating some of the key points he provided一use your overall objectives, consider the resources available to your team, and tradeoff the benefits of downforce with reliability, mass, and drag priorities.
6/7b. For a long time, drag was the main aerodynamic consideration for vehicles; however, in the 60s racers started to realize that paying a drag price for additional downforce (negative lift) can result in faster lap times. The friction force between your tires and the road surface increases with normal force on the tires allowing for higher speeds in turns with additional downforce. Remember that tire μ goes down with normal force, but the force for a specific tire will increase with additional downforce. Both downforce and drag are related to the square of velocity and have more significant effects at high speeds. The reference areas (A) can be confusing; vehicles typically use frontal areas and airfoils often use the plan area (product of chord length and span), but this is not always the case, so make sure to check. The remaining terms include the fluid density (ρ) and the coefficients of lift (Cl) and drag (Cd).

6/7c. In addition to identifying the aero package and setup that you believe will have the lowest lap times from analysis and testing (Figure 8 for example), you will want to test and verify the gains you can achieve with different aerodynamic elements added to your vehicle―floor, diffuser, front wing, rear wing, brake ducts, etc. I would not have too much confidence if I relied solely on computational results. You will then be better prepared to tradeoff those aero gains with the corresponding penalties in mass, drag, and reliability. As a team advisor, I have no problem with a team and individuals having objectives to learn new things (like to design and build composite aerodynamic structures), but I would avoid that justification in the design event.

Figure 8. Relative lap time (black, left axis) and lift to drag ratio (blue, right axis) as a function of lift coefficient relative to optimum value. You can generate this data analytically and experimentally and can use it to also understand the effect and interactions of each aerodynamic element added to the vehicle. This is similar to the analysis done in Katz and Dykstra, Effect of Wing/Body Interaction on the Aerodynamics of Two Generic Racing Cars, SAE Technical Paper 920349, 1992, but hopefully it won’t be generic in your case.
6/7d. The integration of your aero package with your cooling design, tires, suspension, vehicle dynamics, etc. should not be neglected.
Drivability
In this category I will present characteristics and parameters that govern the ability of your driver to operate near the performance envelope of your vehicle. Your driver—and your car—will be faster when they have a lot of control of a stable vehicle that allows them to confidently approach the performance envelope. Due to variation in drivers and the fact you are racing a human-machine system, your choice in the design of these parameters will depend on your drivers.
8. Controls and Ergonomics
8a. This area is too often neglected by teams. I imagine it is because it is harder to quantify its effect on vehicle performance and as engineers we like numbers. However, we can just say here that it is equally as important as any of the other stated parameters and should be given at least equal weighting when making design decisions. See the awesome article Notes on Anthropometry for more details.
8b. Your driver needs to be able to operate all the controls while navigating the course and needs to be able to do so without fatigue, to take a bit from the article above.
8c. Have your drivers practice the events. In Formulas SAE, the experience of your driver in a racing vehicle is much lower than you want for the amount of time you have spent designing and building—and this ratio is even worse for your drivers’ experience in the vehicle you built this year. If you are interested in increasing your performance on track, practice and testing is always the key.
9. Balance
Balance quantifies the tendency for your vehicle to over- or under-yaw and is a result of the relative product of the moment arm from the CG to the friction forces on the front and rear tires. To maximize your speed in the turns, you will want to generate as much lateral force from all of your tires as possible—if your vehicle has poor balance, you will be underutilizing some of your tires’ potential. A slight oversteer balance is theoretically fastest, both in terms of the front tires using additional force to create rotational acceleration, and also higher response rates.
The balance is often seen through the lens of lateral load transfer distribution (LLTD) or the yaw acceleration at peak lateral acceleration; often yaw moment is used as a proxy for yaw acceleration when the moment of inertia of the vehicle is not known. Like longitudinal acceleration versus lateral acceleration envelopes, you can create performance envelopes for the yaw acceleration as a function of lateral acceleration (Milliken Moment Method Diagrams, MMMDs), and these are typically made with isolines for vehicle slip angles and steering inputs. While you do not operate near the edge of this envelope compared to the GGV envelope or are as limited by yaw dynamics as lateral dynamics, your team should understand how to change the setup to get the vehicle reasonably balanced and adjust to the driver’s preferences and different track condition. When testing, quantify the balance of your setup, record it, and compare it to the other measurements of your test to select your setup for different events.
10. Control and Stability
10a. Control is the effect that changing the steering angle has on the yaw acceleration (or yaw moment when you do not know the moment of inertia of the vehicle). A more complex model than I present could include effects of drive torque or braking torque on the yaw acceleration. Control is quantified in the right plot in Figure 9 through change of the yaw acceleration per change in steering input angle (δ); this is approximately related to the slope of the orange line as well. Having increased control provides more feel to the driver and, like balance, can be quantified and compared to your driver’s performance to find the best setup for your driver and why.
10b. Stability is the tendency of your vehicle to return to facing forward when rotated relative to its direction of travel. Stability is quantified in Figure 9 as the change in yaw acceleration per change in vehicle slip angle; this is approximately related to the slope of the red line as well. More negative changes in yaw acceleration and slopes are related to higher stability. In the left schematic of Figure 9 one can see that the rear tires restore and the front tires move the vehicle away from pointing with the direction of travel. Losing traction in the rear or increasing traction in the front of your vehicle will reduce the stability and is one reason for providing rear downforce aerodynamic elements to increase restoring moments from rear tire forces.
10c. While an oversteer balance is theoretically fastest at the limits of grip, it might be slower in reality if drivers stay too far below those limits or exceed the limit and lose time with spins and penalties. Some drivers can avoid big slow slides or spins, and are faster over a stint with more front grip. Some drivers are faster on average with more rear grip, finding the limit when the front will no longer turn in more, sometimes trail-braking to increase yaw rate.

Figure 9.
Left) Forces and angles for a bicycle model of a vehicle showing the velocity of the CG, vehicle slip angle (β, red), steering input to front tire (δ, orange), yaw moment (blue), and lateral forces on the tires (green). The lateral forces are a function of their slip angles (angle between the velocity of the tire and the direction they point) which are a function of the steering input, vehicle slip angle, and yaw velocity.
Right) Yaw acceleration as a function of lateral acceleration showing the performance envelope (thin black line), the grip represented by the maximum lateral acceleration (green arrow), balance representing the oversteer/understeer nature of the vehicle (blue arrow, oversteer in this situation as it is yawing clockwise at the maximum lateral acceleration to the right), the control (orange) representing the amount of yaw resulting from the driver adding steering input, stability (red) representing the restoring yaw acceleration when the vehicle centerline is angled away from the velocity vector of the CG.
Inset) Changes in balance (decreased, more understeer), control (decreased), and stability (increased) when increasing the LLTD (more load transfer and reduced grip on the front axle of the vehicle).
FSAE Is A Project Management Competition
Project management entails having goals, a plan to achieve those goals, a strategic structure, schedule, method for tracking the former items, and cohesion within the team to reach the potential in each team member and each design decision. Using the 10 parameters in this article to set targets, then set resource priorities, then adjust and compromise throughout the year is a core part of successful project management. A well-managed team has an overall strategy, sub-strategies, and backup strategies during design, manufacturing, and the competition itself that compliment their vehicle, presenters, and drivers. A well-managed team will use some resources to support their economic and political goals (at least enough to get support from sponsors and your university). Total Competition by Adam Parr and Ross Brawn is a fun read to get an appreciation of the larger considerations of running a racing organization.
Additional Resources
To perform overall system design, you will need to be knowledgeable enough in it and the various subsystems to make informed decisions about their selection and integration. To that end, I am providing a list of suggested references that we will continue to add to. If you found this article useful, you can find a video explanation here and on the various subsystems on the Cal State LA YouTube Channel.
Chris Bachman teaches Mechanical Engineering at Cal State Los Angeles, and is the faculty advisor for the FSAE and Baja teams there.
https://www.calstatela.edu/faculty/john-chris-bachman-phd-pe
Reading List
Project management
Total Competition, Adam Parr and Ross Brawn
Overall vehicle texts (less to more technical)
Tune to Win, Carrol Smith
Ferrari Formula 1, Peter Wright
Formula 1 Technology, Peter Wright
Race Car Vehicle Dynamics, William F. Milliken and Douglas L. Milliken
Fundamentals of Vehicle Dynamics, Thomas Gillespie
Development of Vehicle Dynamics Tools for Motorsports, Chris Patton
Suspension and chassis
How to Make Your Car Handle, Fred Puhn
Racing and Sports Car Chassis Design, Michael Costin and David Phipps
Force-Based Roll Centers and an Improved Kinematic Roll Center, Wm. C. Mitchell
Numerical Design of Racecar Suspension Parameters, David Woods and Badih Jawad
Powertrain
Internal Combustion Engines Fundamentals, John Heywood
Scientific Design of Exhaust and Intake Systems, Philip Smith and John Morrison
Design of a Tuned Intake Manifold, H.W. Engelman
Aerodynamics
Race Car Aerodynamics, Joseph Katz
Effect of Wing/Body Interaction on the Aerodynamics of Two Generic Racing Cars, Katz and Dykstra, SAE Technical Paper 920349, 1992
Brakes
Brake Handbook, Fred Puhn