Writing the Design Report
General Approach
If you’re anything like me, your FSAE team probably doesn’t start on the design report until the week before its due. We’d then split up the subsections based off of whatever we’ve worked on, throw together a handful of paragraphs, use some fancy words and send this to the team leader about 36 hours before the report was due. The poor leader would then have to compile everything, make it look nice, and write an intro. We were pretty proud of ourselves if we got it in more than 12 hours before it was due.
It’s been a rude awakening being on the other side (as a design judge). Consider the design report your team’s first chance to make a good impression. There is a lot of information out there that describes the design event, and so I recommend reading up on the details of it. Understanding the event and how it’s run and scored will greatly help you prepare for it. Once you submit the design report, the design judge captains go through and read each and every one of them. Yes, well over 100 design reports. From the first read, the reports are given a rough estimate of the quality of the team/car. As the date gets closer to the competition the captains will distribute the reports across the design bays… essentially trying to evenly distribute the expected top teams across the queues, along with the mid pack teams and so on. Each design queue knows this, and if your team’s report is not in their top one or two, it is much more difficult to make it to design finals. So, how does one ensure your team is in the top group? What are the characteristics of the best teams?
To start with, your team will want to be collecting information all along the way. So from the initial conceptual design and brainstorming, it’s best to document your progress. Even if these are just quick notes and back of the envelope calculations, you’ll want to record these for later. Keep notes from design reviews, along with what assumptions you’ve had to make. Note the design compromises and refer back to previous team’s reports to see if you’ve made an overall improvement or have chosen a different point along the existing curve. Take photos and keep track of tests done on subsystems, as they’ll provide valuable insight on the overall design. Once you start to actually write the report, you’ll want to tell a (technical) story of your progress. Starting with last year’s report and adding/subtracting/editing it can lead to high scores, however a brand new report written from scratch, then compared to previous reports and then improved upon will more than likely garner a higher level of understanding and technical communication.
The Text
My recommendation is that of a “long form five paragraph essay”. Start with a very brief intro, and then tell the reader exactly why your car is going to be the best one at the competition. Provide a few supporting points and then break into subsections. It's in this intro part, you want the reader to furl an eyebrow and say “hmmm, interesting I want to know more”.
Each subsection could also be a form of the “five paragraph essay”. Its points/arguments should all support the main points you made at the beginning while also being able to be read as a stand alone section. It’s a good idea to highlight the areas you worked on, these are generally the points of discussion the design event will start with. This is your opportunity to direct some of the focus to where you put your team’s energy, as the design judges will likely want to know how much you know about that particular subject. Ideally you want to touch on every bit of the design, testing, building process but the idea is to highlight the areas your efforts went into. For example, if your main goal was fuel efficiency then each subsection should mention that; ie, less drivetrain losses, how a focus on reducing mass increases fuel efficiency, does aero make the car more or less fuel efficient, approach to engine tuning and so on. Your suspension subsection should touch on all the kinematics, forces, springs, dampers, vehicle dynamics etc, but there should be a focus on how all of these help to improve fuel efficiency.
Having and showing an understanding of the compromises in the design of a subsystem will also garner higher marks. For example, running through the brake calculations once and showing chosen components demonstrates that you can find the brake system equations and input some numbers. But if you can show how each of the inputs/assumptions affect the outcomes (CG height, coefficient of friction, brake temperature, total weight, pedal input force etc.), and how you arrived at those inputs, you can demonstrate that you more fully understand the physics behind the problem.
Finally, we recommend breaking up the text based on the design sheet and judge roles. The most typical judge group is broken into: Frame'/Body/Aero, Cockpit/Controls/Brakes, Powertrain, and Suspension. Systems Management/Integration, Manufacturability/Serviceability, will generally have input from all the judges in the group, while electrical subsystems (for an internal combustion car) will generally be added on to an existing judges’ task. Breaking the text (and your design presentation team) into these subsystems will allow the team of judges to more efficiently garner information from your team.
Graphs and Figures
Instead of thinking that you have to fill up X number of pages for the design report, the mentality should be “how can we fit all of our knowledge and work into these pages?” Your team has been working on a project for 6, 9, or 12+ months at this point. And I’m sure that even a small team of 6 people can write a lengthy report on all the work that has been done. Graphs and figures are a great way to communicate complex ideas in a small amount of space and time.
The following figure is used with permission from the Wisconsin Madison FSAE team.

By showing a figure you can demonstrate a more thorough understanding of the subject matter. Instead of displaying a single number for the final drive ratio, you can show that you’ve gone through a number of permutations and have an understanding of the design space and the affect the inputs/assumptions have on the outcome. With a short sentence or two you can explain your reasoning behind your choice and/or the methodology you took while creating the figure. Presenting clear, dense information also carries over to the design event itself.
From my college years, I can provide this figure. It was an early calculation trying to figure out how much energy we would need for a Formula Hybrid SAE vehicle. With batteries contributing a large portion of the mass to the final vehicle, I created estimates for the mass of the rest of the vehicle, an assumed acceleration rate and a duty cycle on the acceleration. With an energy density for the battery chemistry, I ran the numbers and determined we needed just over 2 KW*hr to complete half the endurance event, where we could recharge.

Early Energy Estimates for the Formula Hybrid Endurance Event
However, from the graph we see that the energy required to complete the endurance event didn’t change that much based on the total weight of the vehicle/weight of the batteries on the vehicle. Over the range studied (25N to 300N of batteries), the required energy for the endurance event changed on the order of 15%. Therefore, slightly erring on the side of more energy/battery mass would allow us to increase our average acceleration rate or amount of time accelerating. We settled on two “2 Kw Hr” packs giving us ~3 Kw Hr of usable energy for each half of the endurance event, as this size was readily available for us “off the shelf”.
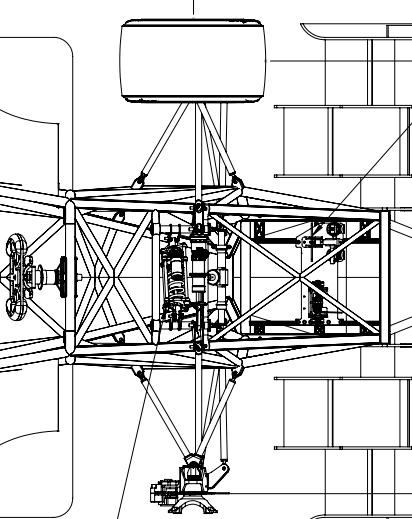
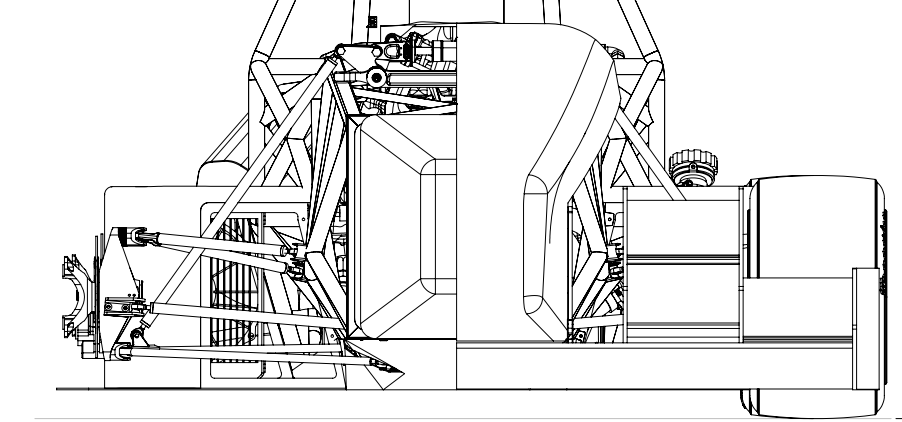
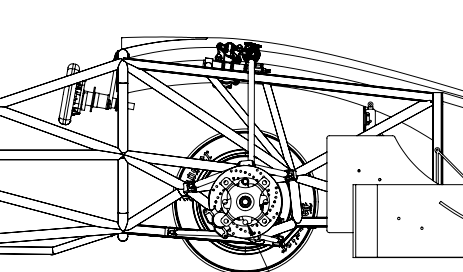
While a screenshot of FEA/CFD or a rendering will show you can use the software and provide nice looking marketing material, a detailed three view drawing will allow the reader to determine if your team understands load paths, kinematics, packaging, etc.
The following figures are used with permission from the University of Nebraska Lincoln FSAE team. They are snippets from their three views of the full car; from the three views we are able to get a good idea of the load paths, their efforts in triangulation, along with some approximations on the suspension kinematics, component sizing, and overall packaging. A single isometric view of the chassis in FEA will communicate max deflection/stresses in a design, but won’t be able to show us much more.
CONCLUSION
The design report isn’t just a subsection of a portion of the FSAE competition. Taking a holistic approach to the competition will ensure a better design report and in turn a better car, a better understanding and a higher overall score. When you’re able to teach something you have a higher understanding. The design report should teach what makes a good car.